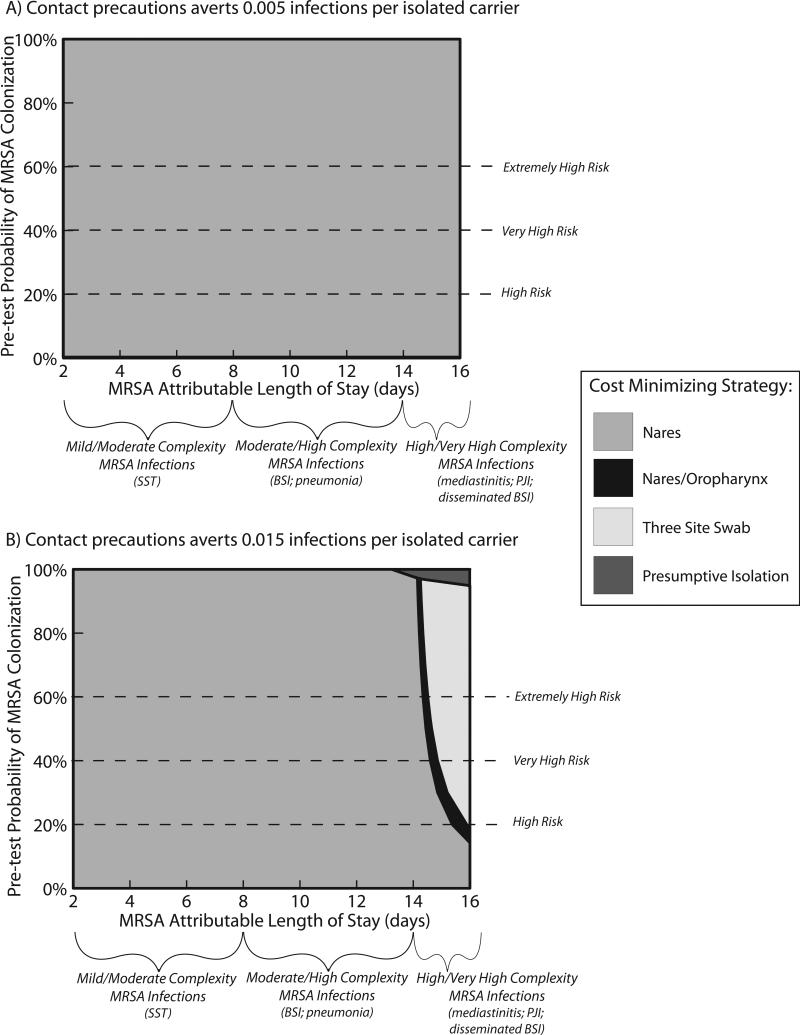
Figure 2.
Sensitivity analysis of increasing the impact of MRSA infection, measured as attributable length of stay [y-axis], and efficacy of contact precautions, measured as number of infections averted [x-axis]. The shaded area represents the optimal surveillance strategy, i.e. cost=benefits or costs<benefits. The sensitivity analysis is presented for baseline conditions of MRSA colonization (10%) and for colonization prevalence of 20% and 30%.
Units of number of infections averted are per MRSA carrier placed in contact isolation.

