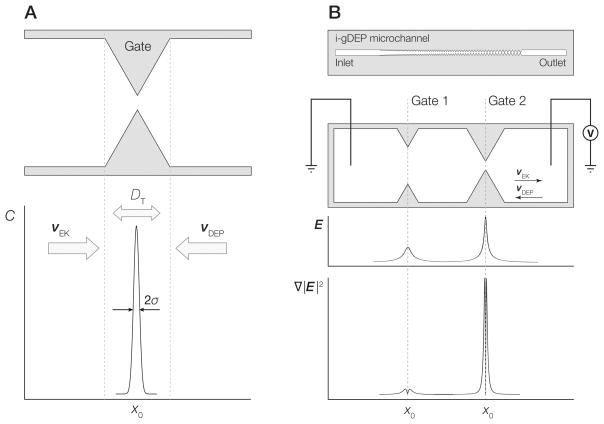
Figure 1.
A) Diagram depicting concentration of analyte at a gate structure within a g-iDEP microchannel. Peak width is a function of focusing factors associated with electrophoretic velocity (νEK) and dielectrophoretic velocity (νDEP) balanced with dispersive forces including diffusion (Ddiff). B) (upper image): Schematic representation of an entire g-iDEP device. (lower three panels): Detail of two gates within a g-iDEP microchannel. Below the gates are representations of the absolute magnitude of the centerline electric field strength and ∇|E|2. The device shown here serves only illustrative purposes. Specific implementation and geometry of gates are flexible, and may be altered significantly depending on the desired application. Gates may also be operated in parallel, attaining the same resolution as expressed in this document.

