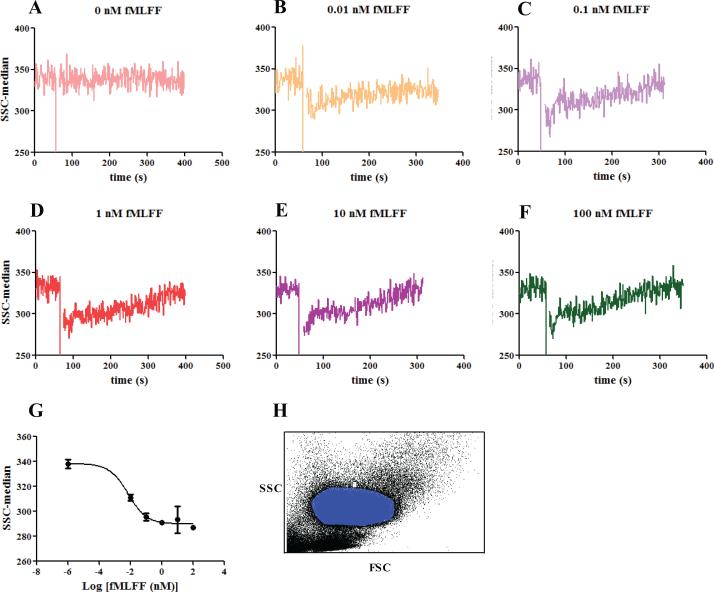
Figure 1.
Right angle side scatter reading of PMNs stimulated with different concentrations of N-formyl peptide. (A) DMSO control; (B) 0.01 nM fMLFF; (C) 0.1 nM fMLFF; (D) 1 nM fMLFF; (E) 10 nM fMLFF; (F) 100 nM fMLFF. (G) The side scatter changes caused by fMLFF were fitted to the dose-response equation with variable slope using GraphPad Prism 5. EC50= 0.007 nM. Ten data points right after fMLFF peptide stimulation were averaged and used for the graph. (H) A representative FSC versus SSC plot of the blood samples and the gating of PMNs (blue area) are shown. The PMNs were withdrawn from two healthy donors. For donor 1, the experiment was conducted in duplicates; for donor 2, the experiment was done in triplicate. Representative curves are shown.

