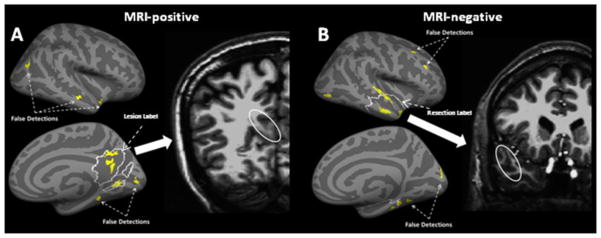
Figure 2.

Detection results for the ML based approach for (A) an MRI-positive and (B) an MRI-negative patient. The inflated lateral and medial cortical surfaces show the original expert-traced lesion (A) or the resection zone (B) as the regions outlined by the white solid curve. The significant lesional clusters discovered by the ML are shown in yellow. The MRI slice on the right shows the abnormal area corresponding to the clusters discovered inside the lesion/resection on the actual brain volume.
