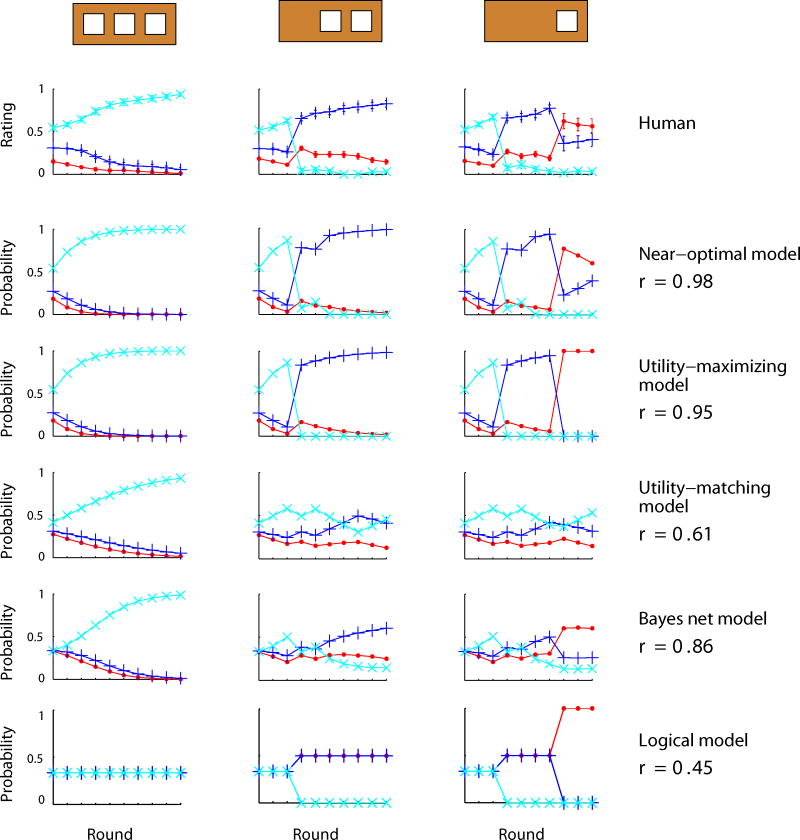
Figure 11.
Experiment 3 results and model predictions for the three conditions. In all plots, the cyan line (× markers) corresponds to the three-hole information filter, the blue line (+) corresponds to the two-hole information filter, and the red line (·) corresponds to the one-hole information filter. The error bars in the human plots are standard errors. For the models, r is the correlation coefficient between the model's predictions and the human judgments.

