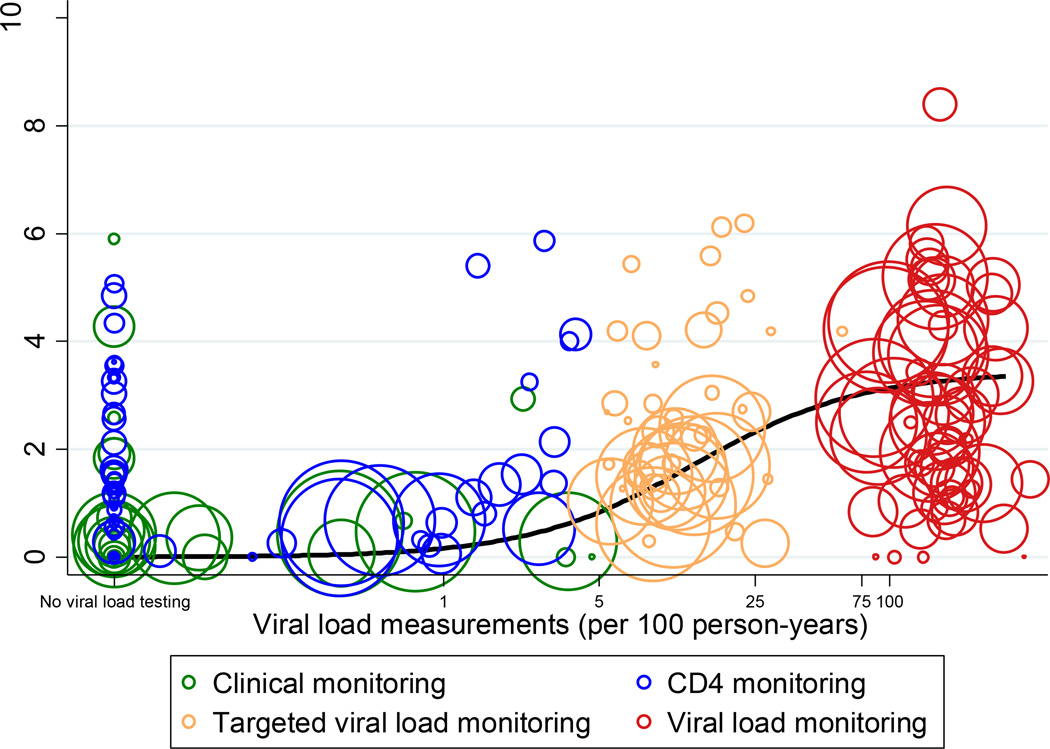
Figure 2. Viral load testing and switching to second-line antiretroviral therapy.
Bubble plot of rates of viral load testing and switching to second-line ART according to monitoring strategy. Each bubble represents the estimate for one treatment programme and calendar year. The size of the circles is proportional to the number of person-years in the respective year and programme. The black line shows the fit from regression model. Routine VL monitoring was assumed if at least 75 VL tests had been done per 100 person-years. CD4 monitoring was assumed if at least 75 CD4 counts had been done per 100 person-years. Targeted VL monitoring was assumed if in addition to CD4 monitoring at least 5 but less than 75 VL measurements were done per 100 person-years. A site was considered to use clinical monitoring if it did not meet the criteria for any other monitoring strategy.

