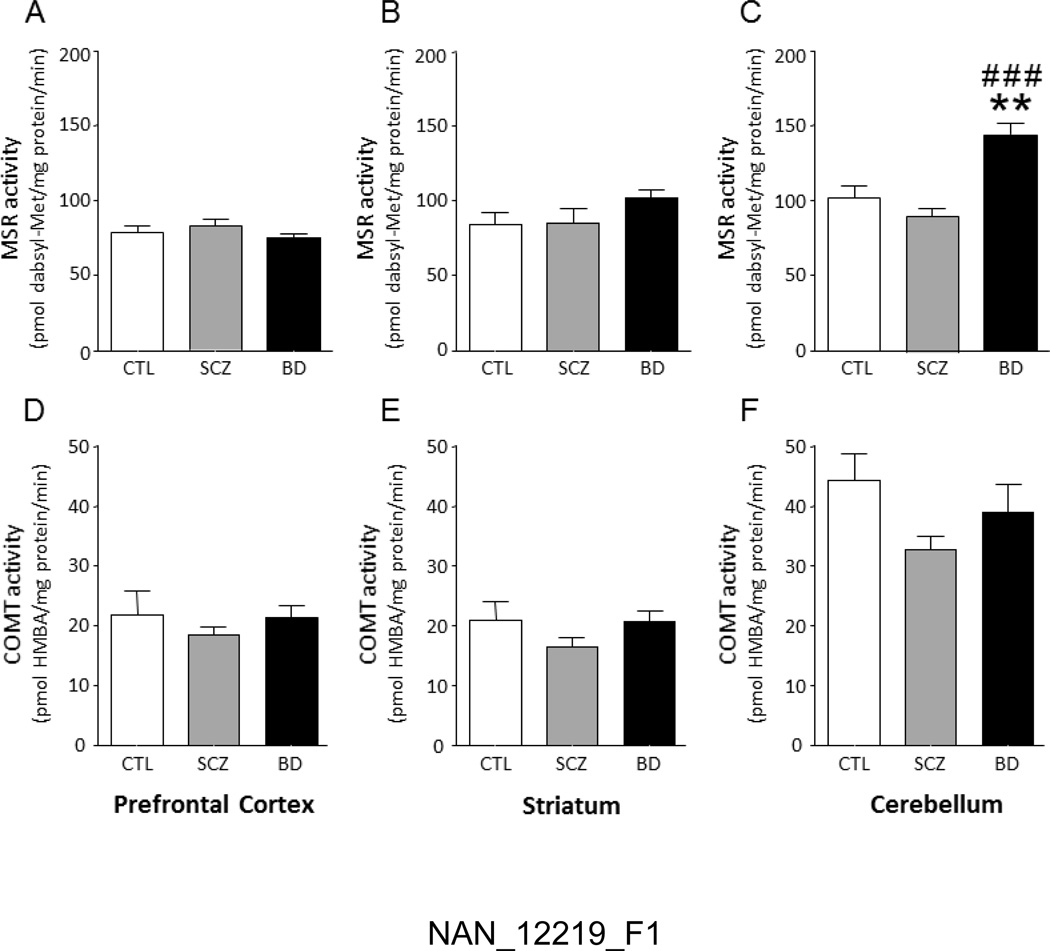
Figure 1. Enzymatic activities of Msr and COMT in human brain regions.
Differences in MSR (A–C) and COMT (D–F) catalytic activities between post-mortem human tissue samples from the prefrontal cortex, striatum and cerebellum of controls (CTL), schizophrenia subjects (SCZ) and bipolar disorder subjects (BD). Values are displayed as means ± SEM. All analyses were run by 1-way ANOVAs. **, P<0.01 in comparison with controls; ###, P<0.001 in comparison with schizophrenia subjects.

