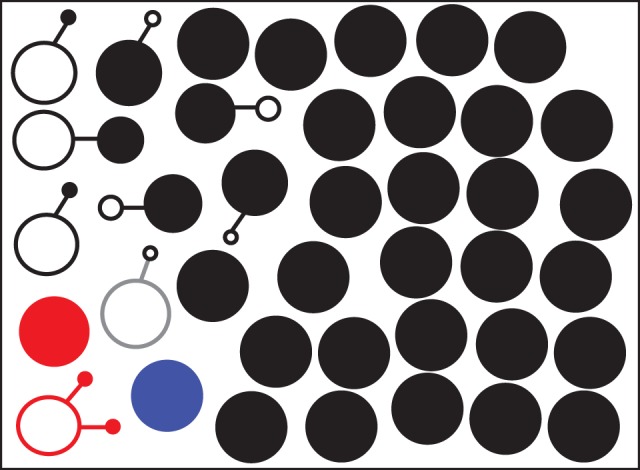
Figure 1.

Phenotypic AMR profiles in 38 MRSA carriers. Each circle represents an AMR profile and connected circles are different AMR profiles from the same carrier. Circle size is proportional to AMR profile incidence in each patient and filled circles represent the AMR profile with the most resistances in that carrier. Black is lineage CC22, blue is lineage CC8, red is lineage CC45 and grey is lineage CC1. This figure appears in colour in the online version of JAC and in black and white in the print version of JAC.
