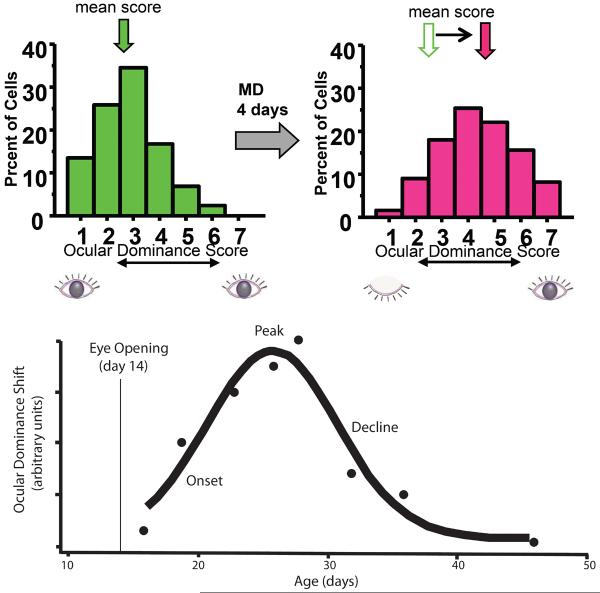
Figure 4.
Ocular dominance plasticity during the critical period in mouse visual cortex. Top. Ocular dominance histograms showing numbers of single neurons as a function of their relative responses to the two eyes before (left, green) and after (right, red) 4 days of occlusion of vision in the contralateral eye. Bottom. Time course of the critical period of sensitivity to the effects of monocular visual deprivation (MD) in the primary visual cortex of the mouse. Data from Gordon and Stryker, 1996.

