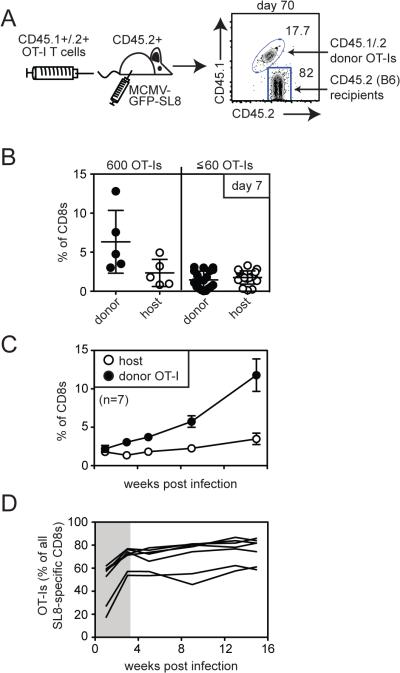
Figure 4.
Selection of OT-Is after comparable primary expansion. A) Schematic of adoptive transfer. B6 (CD45.2+) mice received 600 (n=5), 60, 20 or 6 (n=19) OT-I CD8+ cells expressing both CD45.1 and CD45.2 (DP-OT-Is) prior to infection with MCMV-GFP-SL8. A representative FACS plot of donor/host discrimination is shown. B) Host and donor SIINFEKL-specific T cells in the peripheral blood were measured 7 days post infection by intracellular cytokine staining for IFN-γ production. Data are combined from three independent experiments. C) Inflation of donor OT-Is and host-derived SIINFEKL-specific T cells in the peripheral blood is shown for mice that received ≤ 60 OT-Is and OT-Is inflated. D) The total SIINFEKL-specific response was measured by IFN-γ production from peripheral blood T cells and the percentage of all responding cells that were donor-derived OT-Is was plotted over time for the mice shown in “C” (n=7). Data are combined from the three experiments. The shaded area visually denotes the period of time during which OT-Is increased relative to host-derived SIINFEKL-specific T cells.

