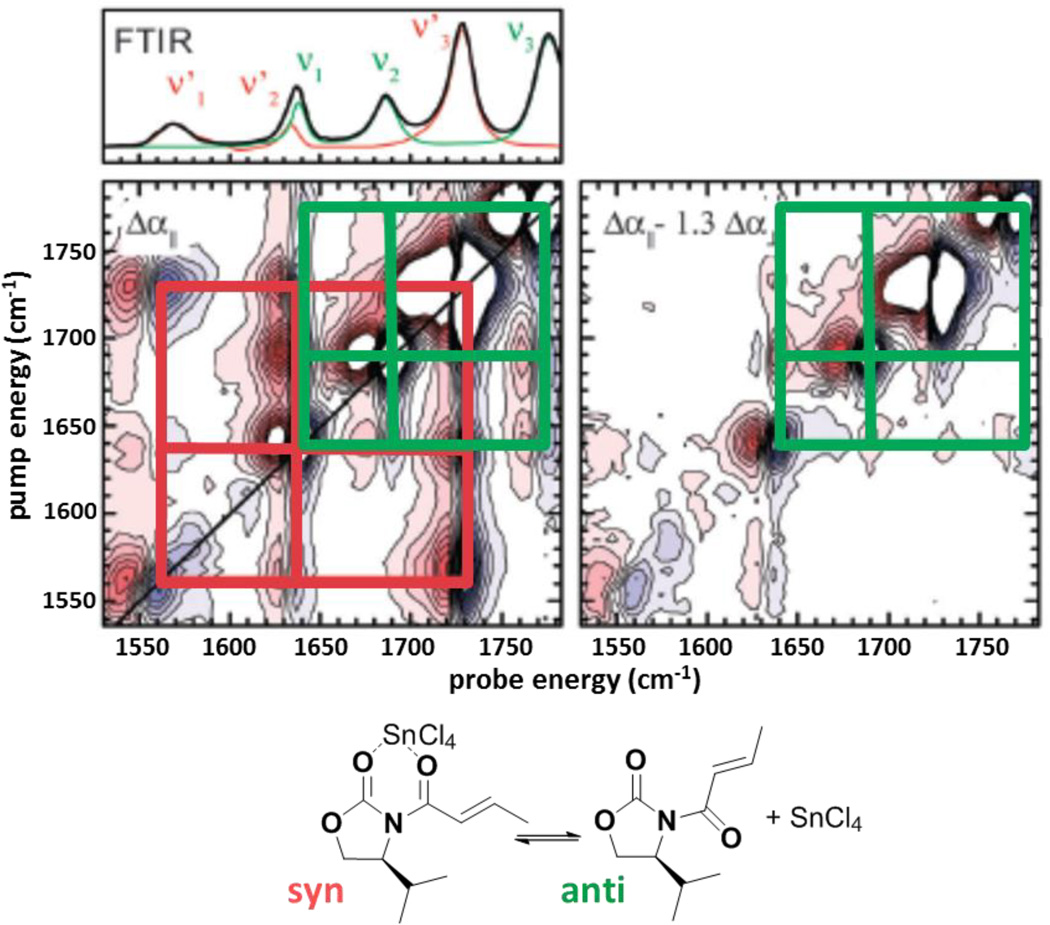
Figure 2.
Polarization-dependent 2D IR spectra of an equimolar solution of Diels Alder substrate N-crotonyloxazolidinone and catalyst SnCl4 (see text). Each of the red and green gridlines indicate bands due to a single species. The FTIR spectra are shown above the left panel for the mixture (black), the substrate (green), and the catalyst (red). The structures of the syn conformer of the substrate-catalyst complex and the anti conformer of the substrate are shown below. Adapted from Ref. 35 with permission from the PCCP Owner Societies.

