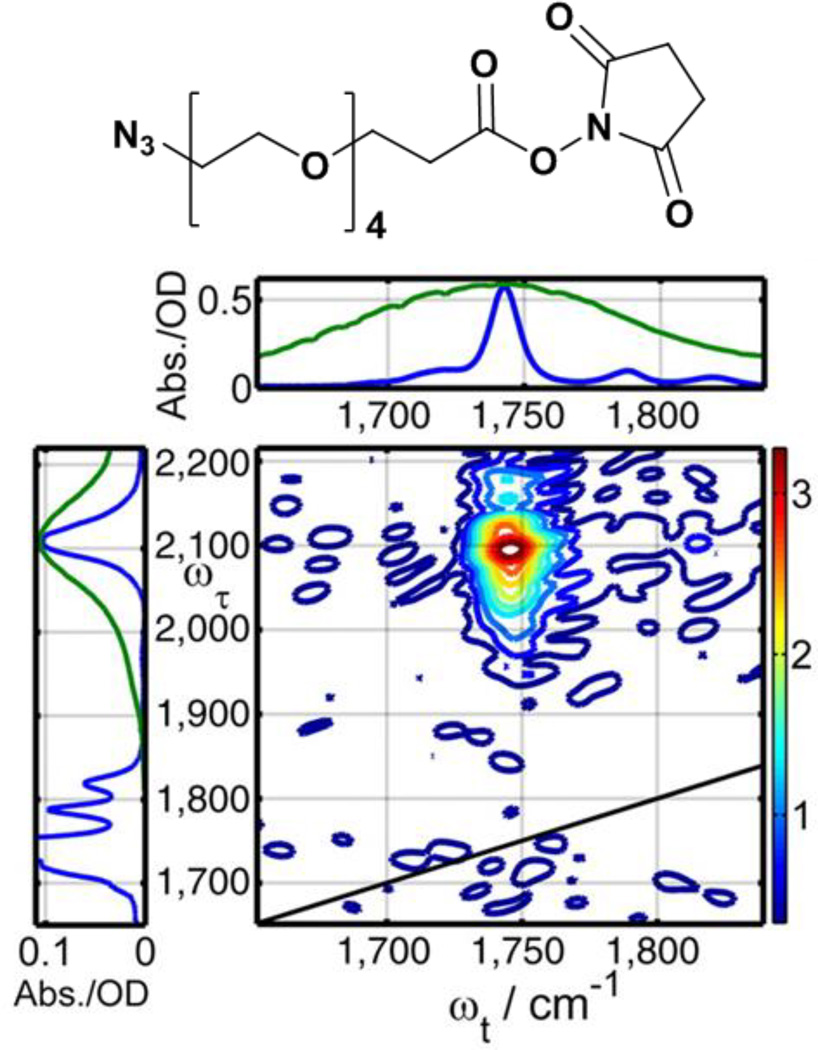
Figure 5.
Structure and 2D IR spectrum of PEG4 with azido and succinimide ester reporter labels (Tw of 60 ps). To the left and above the axes of the 2D spectrum are the FTIR spectra of the labeled PEG4 molecule (blue) and spectra of the laser pulses (green) used to pump and probe the molecule, respectively. Reprinted with permission from Lin, Z. and Rubtsov, I.V. Proceedings of the National Academy of Sciences of the United States of America, 2012, 109, 1413 – 1418.

