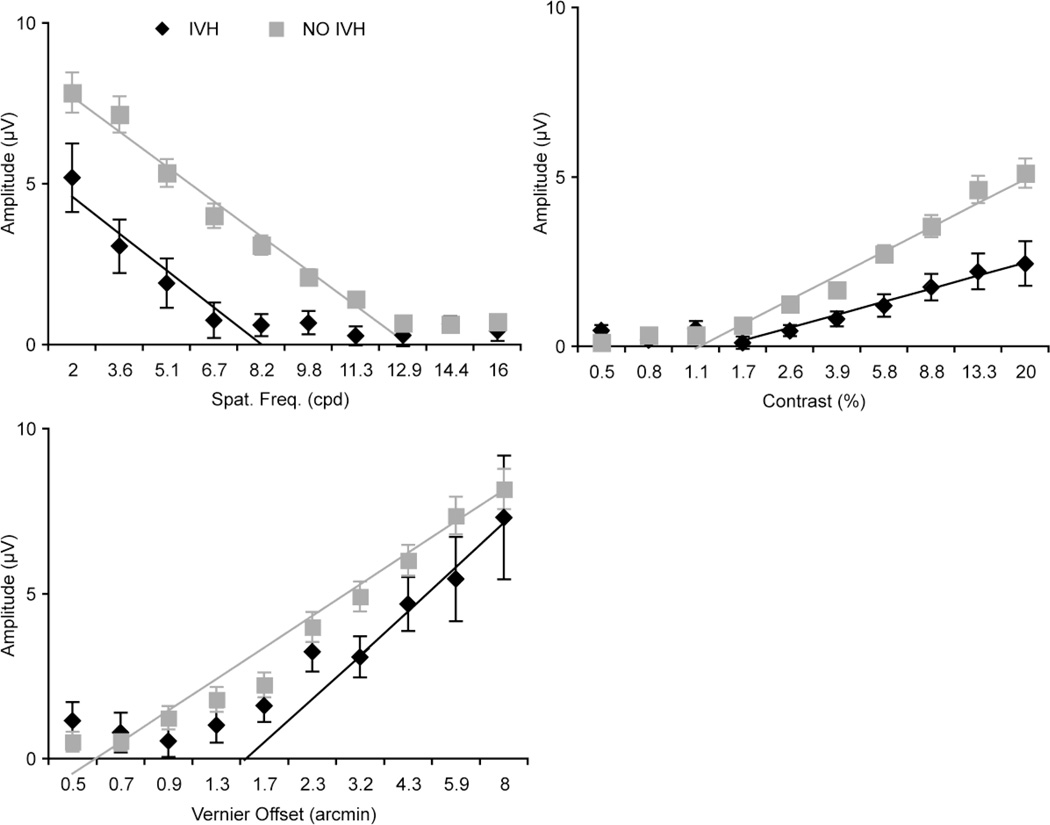
Figure 1. Mean response functions for each of the three visual measures.
Vector averaged sVEP response functions at Oz derivation in infants with IVH (black diamonds) and without IVH (gray squares) for (clockwise from bottom left) vernier offset, grating acuity, and contrast sensitivity. Error bars are +/− 1 standard error of the means. The solid lines are the regression lines used to estimate threshold and slope of the function (see Table 2 and 3). Amplitudes were lower for the all visual measures in the Grade I/II IVH group compared to no IVH group. Statistically significant differences are present across the entire sweep range for all 3 functions, except for vernier acuity, as shown.

