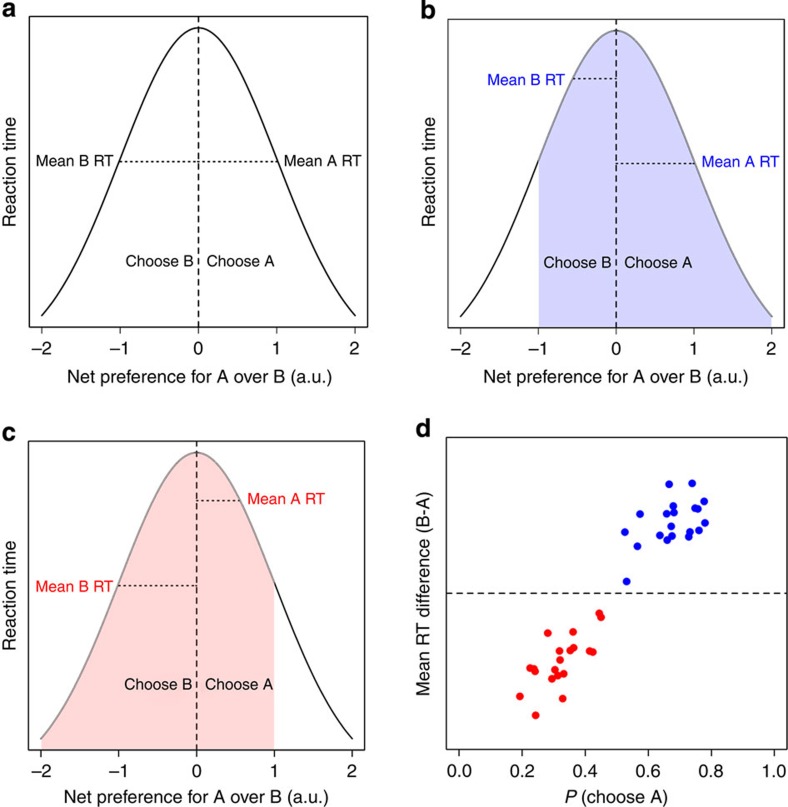
Figure 1. Effect of experimental design on observed RTs.
Here we show a standard relationship between reaction time (RT) and the strength-of-preference between two options A and B. We assume that if the net preference for A is positive, A will be chosen over B, and vice versa. (a) If the experimenter constructs choice problems by sampling symmetrically from the left and right side of the plot (that is, A and B are equally liked on average), then A choices and B choices should on average take an equal amount of time. (b) If the choice set includes more options with a larger net preference for A (blue shading), A will be chosen more often, and A choices will be faster on average than B choices. (c) Conversely, if the choice set favours options with a larger net preference for B (red shading) B will be chosen more often, and B choices will be faster on average than A choices. (d) The difference in mean RT between B and A choices as a function of the overall probability of choosing A. Each dot represents one simulated subject faced with choice options drawn from either the blue shaded experiment where the net preference and probability of selecting A is greater or the red shaded experiment where the net preference and probability of selecting B is greater. The dashed line indicates an RT difference of 0. We see that choice sets near indifference (that is, P(choose A) =0.5) have small differences in RT between B and A choices. However, this difference in RT increases as the probability of choosing A becomes more extreme (that is, closer to 0 or 1).

