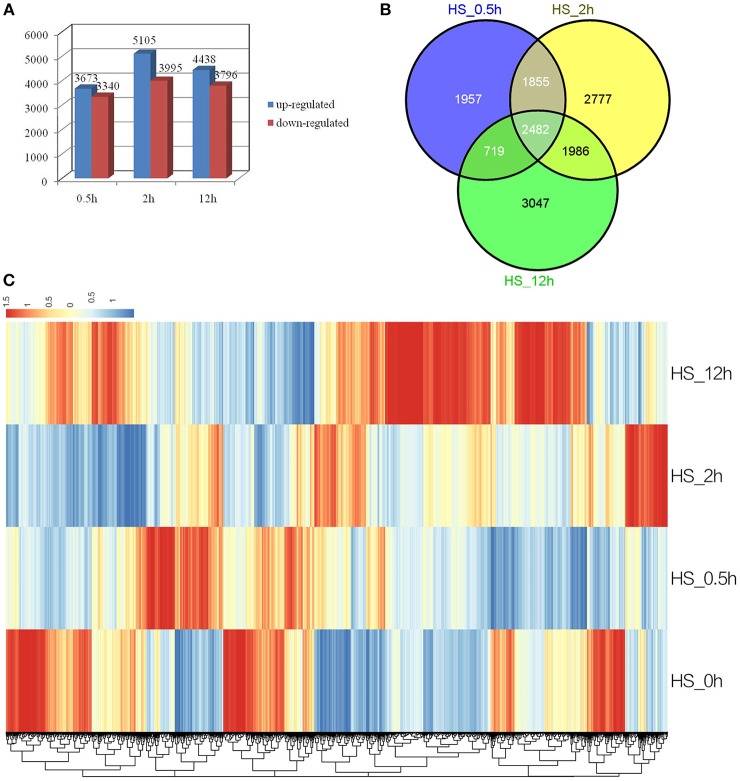
Figure 2.
Analysis of differentially expressed genes in response to HS. (A) Numbers of the significantly regulated genes at the three HS treatment time points. The numbers on the horizontal axis represent the three time points while, the vertical axis reflects the numbers of up-regulated and down-regulated genes. Up- and down-regulated genes are shown in blue and red bars, respectively. (B) Venn diagram analysis of the significantly regulated genes at the three HS treatment time points. (C) Heatmap clustering of global pattern of the significantly regulated genes conducted using Hierarchical Clustering (HCL) algorithm at the three HS treatment time points. The color scale represents the values of lg FPKM (FPKM – Fragments Per Kilobase of transcript per Million fragments mapped).

