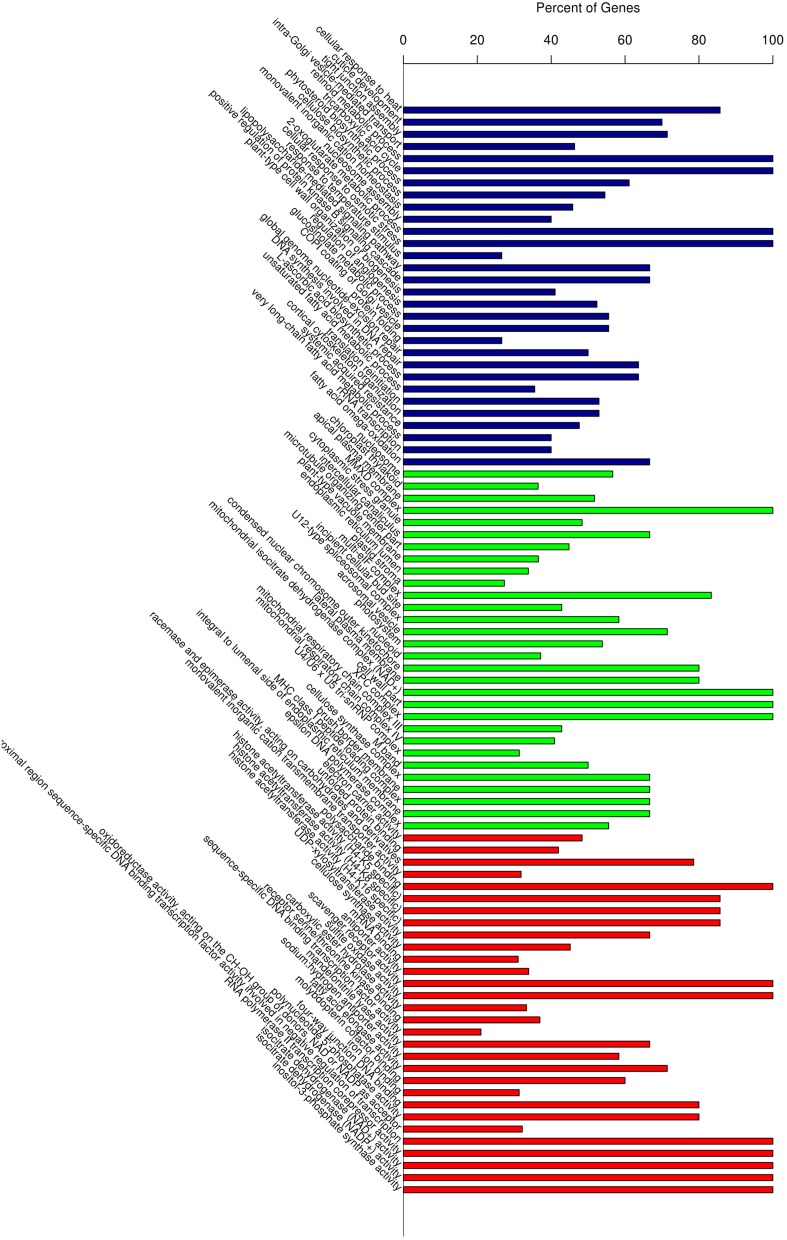
Figure 5.
Gene Ontology (GO) enrichment analysis of all the differentially expressed genes. Vertical axis displays the percentage of significant genes corresponding to each functional type. Horizontal axis displays the GO annotation corresponding to the three categories: from left to right: BP, CC, and MF, represented by colors: blue, green, and red), respectively. BP, Biological Process; CC, Cellular Compartment; MF, Molecular Function.

