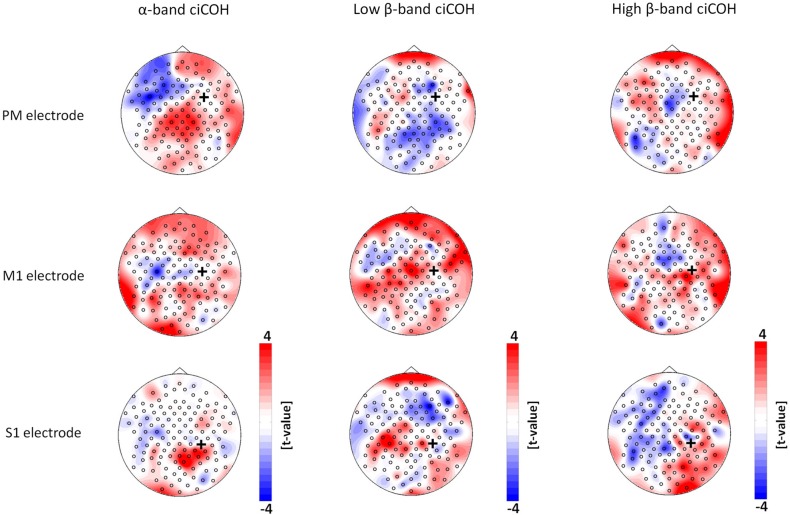
Figure 4.
Seed electrode analysis for the right hemisphere. The plots show t-value topographies of ciCOH POST- vs. PRE-training differences with seed electrodes (marked by black cross) in premotor (PM, upper panel), primary motor (M1, middle panel), and primary somatosensory regions (S1, lower panel) of the right hemisphere. The first column shows the results for the α-band, the second column for the low β-band, while the third column shows the results for the high β-band. Note that no significant differences were observed.

