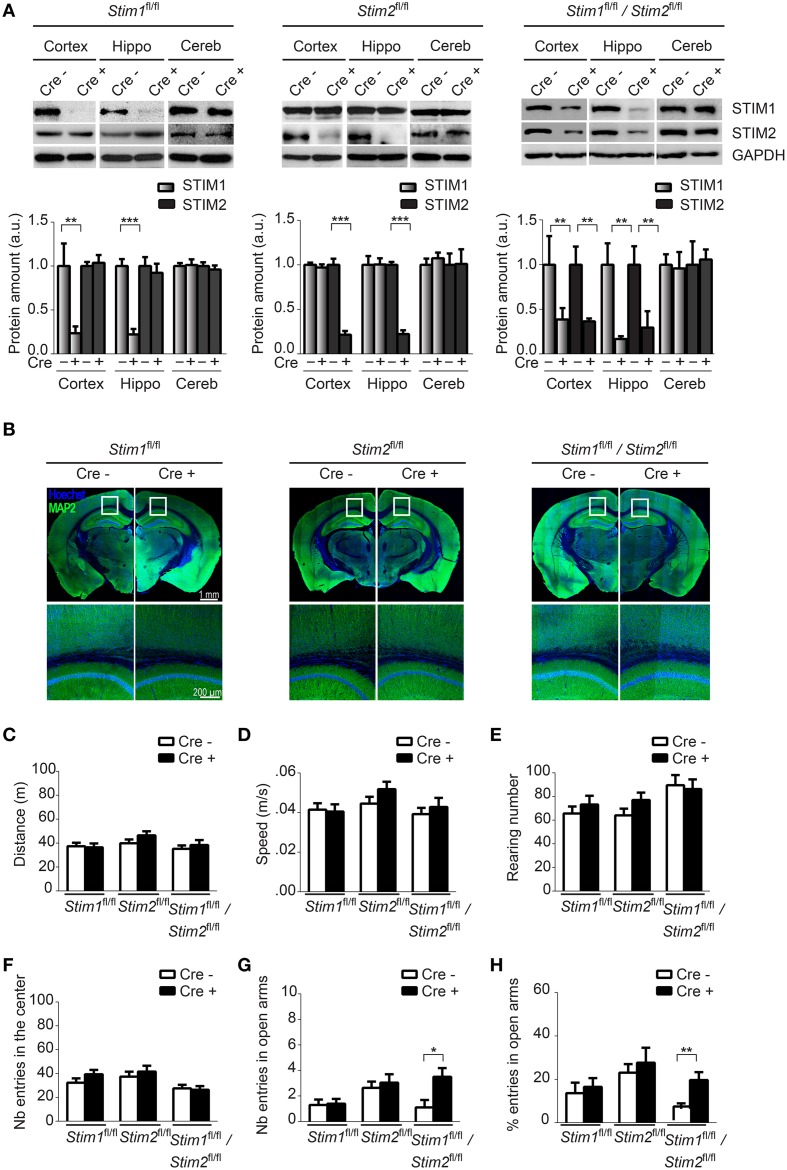
Figure 1.
Characterization of forebrain-specific Stim cKO mouse strains. (A) Upper panels. Immunoblots of STIM1 and STIM2 from cortex, hippocampus (hippo), and cerebellum (cereb) harvested from adult Stim1fl/fl;Cre+ (cKO) and Cre− (control), Stim2fl/fl;Cre+ and Cre−, and double Stim1fl/fl/Stim2fl/fl;Cre+ and Cre− mice. Lower panels. Quantification of STIM1 and STIM2 abundance in the Stim lines indicated on top. 6 brains were analyzed for each genotype. Data are normalized to Cre− controls. Blot exposures were adjusted for optimal comparison of Cre− and Cre+ groups and thus do not accurately reflect relative abundance of the STIM isoforms in different brain regions. Means ± SD are shown. **p < 0.01 and ***p < 0.001, t-test. (B) Coronal sections of adult mice (4 months old) immunostained for MAP2 (a neuronal marker) and nuclei (Hoechst). Lower panels are a magnification of the area indicated in the upper panels and show the neuropil in part of the cortex and CA1 region of the hippocampus. (C–F) Locomotor activity probed by the open field test. (C) distance traveled, (D) average speed, (E) rearing, and (F) propensity to visit the center of the field for Stim1fl/fl;Cre+ and Cre−, Stim2fl/fl;Cre+ and Cre− and Stim1fl/fl/Stim2fl/fl;Cre+ and Cre− mice. n = 10 for each group. Means ± SEM are displayed. There is no significant difference across all genotypes. Number (G) and percentage (H) of entries in open arm of the elevated plus maze for Stim1fl/fl;Cre+ (n = 10) and Cre− (n = 10), Stim2fl/fl;Cre+ (n = 22) and Cre− (n = 22) and Stim1fl/fl/Stim2fl/fl;Cre+ (n = 10) and Cre− (n = 10) mice. Means ± SEM are shown. *p < 0.05, **p < 0.01.

