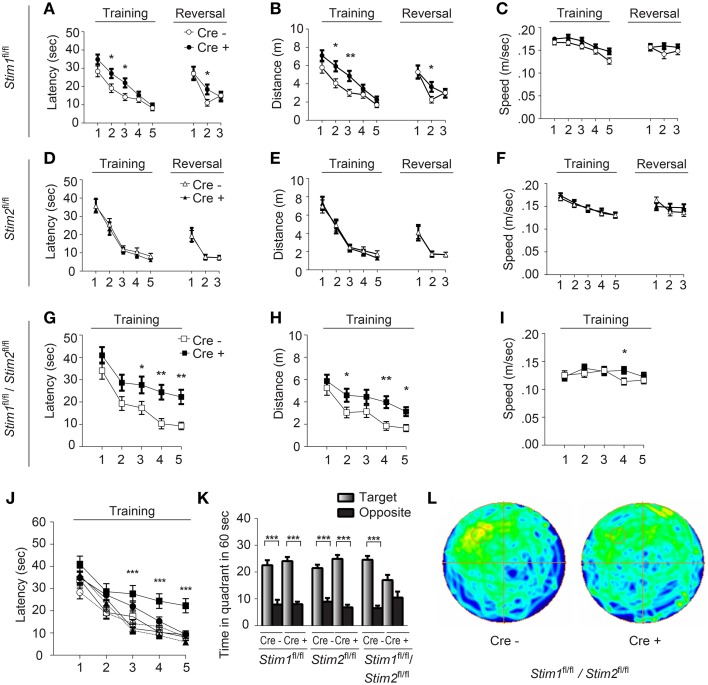
Figure 2.
Stim1/Stim2 cKO mice show severe spatial reference memory deficit in the Morris water maze. Latency to find the escape platform (A,D,G,J), distance (B,E,H), and speed (C,F,I) plotted for each training day, or during spatial reversal, for (A–C) Stim1fl/fl;Cre+(n = 18) and Cre− (n = 14), (D–F) Stim2fl/fl;Cre+(n = 10) and Cre− (n = 10), and (G–I) Stim1fl/fl/Stim2fl/fl;Cre+ (n = 10) and Cre− (n = 10) mice. Means ± SEM are shown. *p < 0.05, **p < 0.01, ANOVA comparison for each day. (J) Latency to find platform for each group. Symbols as in (A,D,G). Mean ± SEM are shown. ***p < 0.001, ANOVA. (K,L) Probe trial. (K) Time spent in the target and opposite quadrants. Means ± SEM are shown. ***p < 0.001, Two-Way ANOVA. Only target and opposite quadrants are shown. (L) Group occupancy plot for Stim1fl/fl/Stim2fl/fl;Cre+ and Cre− mice. The platform was located in the upper left quadrant prior to the probe trial.

