Figure 4.
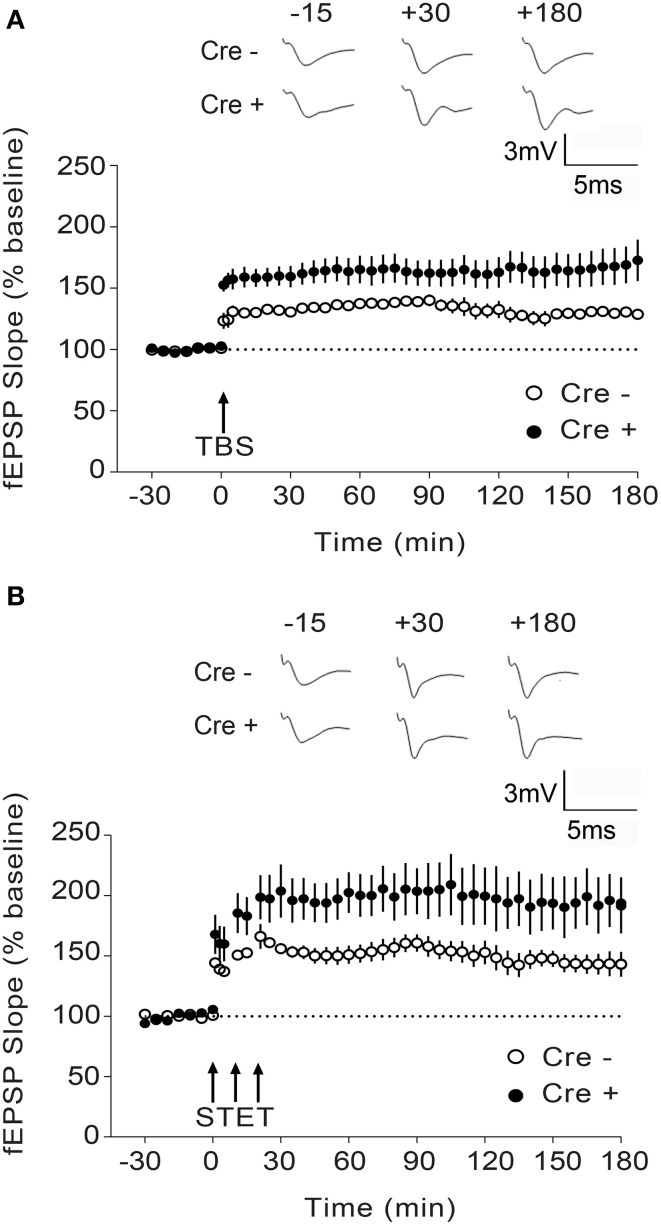
Enhanced L-LTP in Stim1/Stim2 cKO mice. (A) Theta burst (TBS)-induced LTP recorded in CA1 from Stim1/Stim2; Cre+ (n = 8 slices from 5 mice) mice and their control (Cre−) littermates (n = 6 slices from 4 mice). Potentiation in both cases is significantly different from the pre-induction values (+180 min, p < 0.01; paired t-test). By the end of 3 h, mean potentiation of Cre+ group (172.71 ± 16.85%) is significantly different from Cre− group (128.72 ± 3.65%); Two-sample t-test, p < 0.05. (B) Strong tetanization (STET)-induced LTP recorded in CA1 from Stim1/Stim2;Cre+ (n = 6 slices from 4 mice) mice and their control (Cre−) littermates (n = 7 slices from 3 mice). Potentiation in both the groups is significantly different from the pre-induction values (+180 min, p < 0.01; paired t-test). By the end of 3 h, mean potentiation of Cre+ group (194.75 ± 21.13%) is significantly different from Cre− group (143.12 ± 9.16%); Two-sample t-test, p < 0.05. The insets show representative fEPSP traces at −15, +30, and +180 min before and after stimulation. Data are plotted as mean ± SEM.

