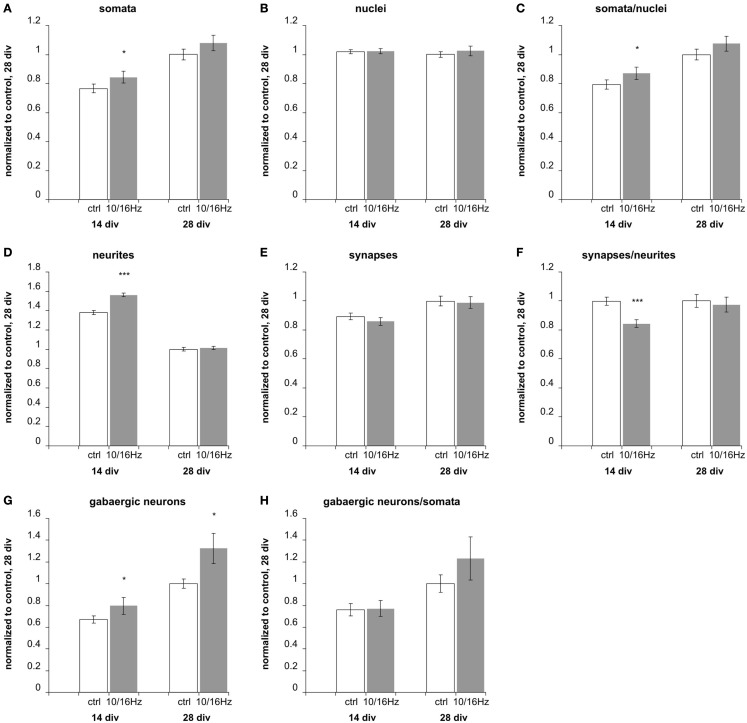
Figure 6.
Effects of 10 and 16 Hz pulse modulated 150 MHz electromagnetic field exposure on the development of cortical network morphology. Semi-automatic quantification of neurons/image, total cell nuclei/image, neurites/image, and synapses/image and extraction of the neuronal marker: (A) total cell number, (B) number of neurons, (C) percentage of neurons, (D) number of neurites, (E) number of synapses, (F) synapses per neurite, (G) number of GABAergic neurons, (H) percentage of GABAergic neurons of neurons. Statistical significance is shown for the comparison between the control and the ELEMF group (mean ± SEM, Student’s unpaired t-test: *p ≤ 0.05; **p ≤ 0.01; ***p ≤ 0.001).

