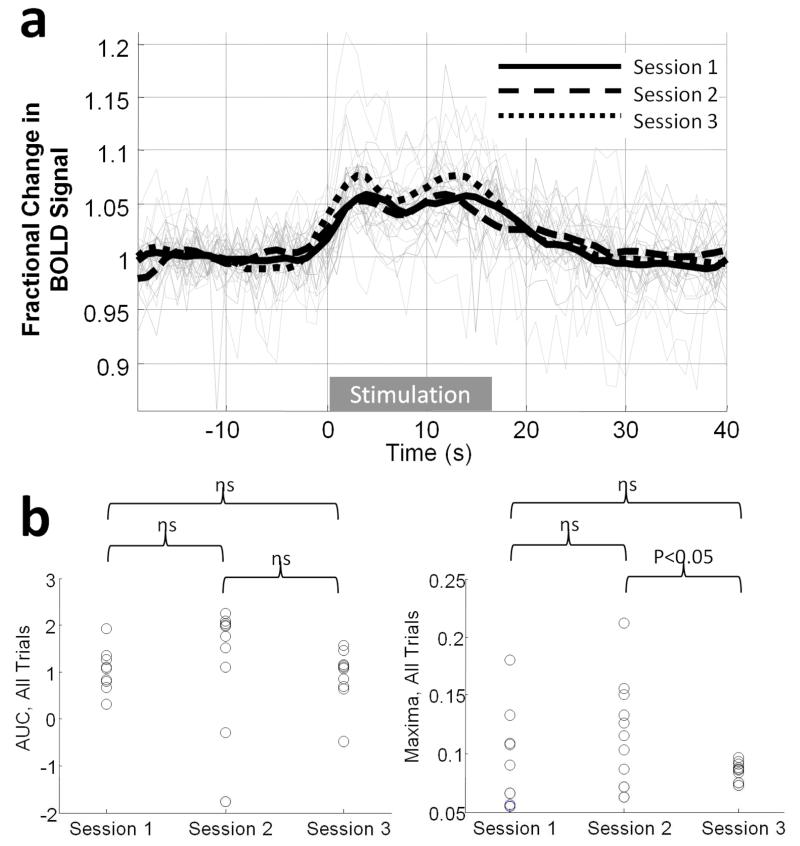
Figure 4.
Response consistency over individual 40Hz stimulus trials and over experimental sessions within a single animal. (a) All responses from three, 10-trial experimental sessions conducted on different days (grey lines) with session-averages overlayed (black lines). (b) Scatter plot of response magnitude for each trial over the three sessions in terms of either area under the curve (left) or maxima (right).

