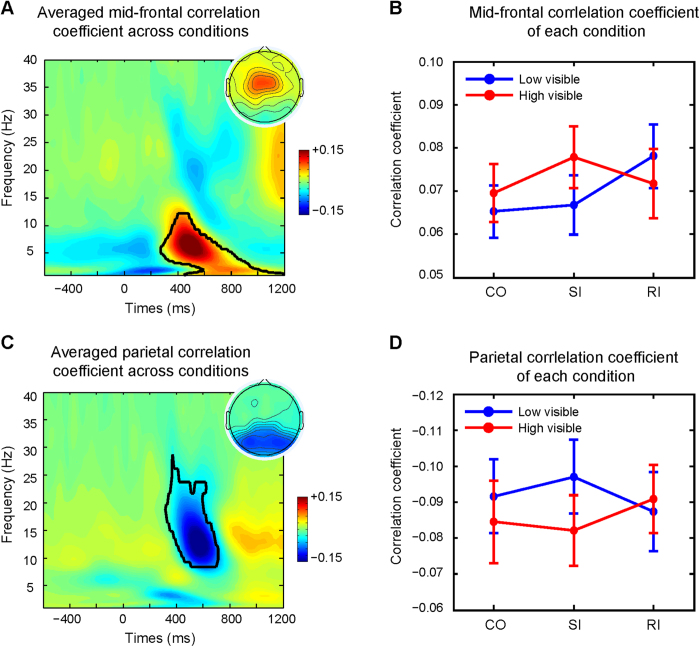
Figure 3. Time-frequency plots of the correlation between single-trial power and RT across all conditions at the mid-frontal ROI (top) and the parietal ROI (bottom).
(A) Time-frequency correlation coefficient plot averaged across all conditions at mid-frontal ROI. Time 0 is the onset of the target. Black lines encircle regions of significance at p < 0.001, corrected for multiple comparisons using cluster-based statistics. The averaged theta-band RT correlation coefficient in the enclosed significant area was used for the topographical plots shown in the upper right corner. (B) Line plot for the correlation coefficient of the significant time-frequency region of interest (all pixels encircled in A) at mid-frontal ROI separated by visibility and congruency. (C) Time-frequency correlation coefficient plot averaged across all conditions at parietal ROI. Time 0 is the onset of the target. Black lines encircle regions of significance at p < 0.001, corrected for multiple comparisons using cluster-based statistics. The averaged alpha-band correlation coefficient in the enclosed significant area was used for the topographical plot shown in upper right corner. (D) Line plot for the correlation coefficient of the significant time-frequency region of interest (all pixels encircled in C) at mid-frontal electrodes separated by visibility and congruency. The error bars represent the mean standard error (SEM). CO = Congruent; SI = Semantic Incongruent; RI = Response Incongruent.

