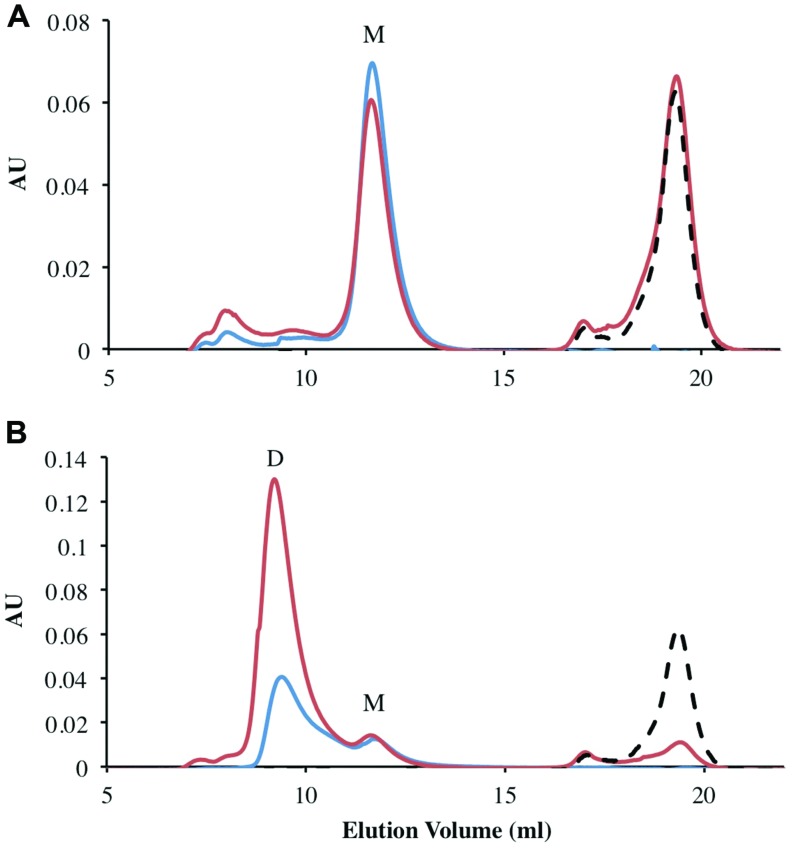
FIGURE 3.
Analysis of oligomeric status of FRedA, FRedB, and FRedA/B using size exclusion chromatography. Proteins (250 μg total) were run alone (Blue) or after incubation with 50 μM FMN (Red). The elution profile of the 50 μM FMN control is indicated by the dotted line (Black). Peaks corresponding to the expected elution volume for monomeric (∼21 kDa) and dimeric (∼43 kDa) proteins are indicated by M and D, respectively. (A) The elution profile for individually purified FRedB; (B) the elution profile for copurified FRedA/B.

