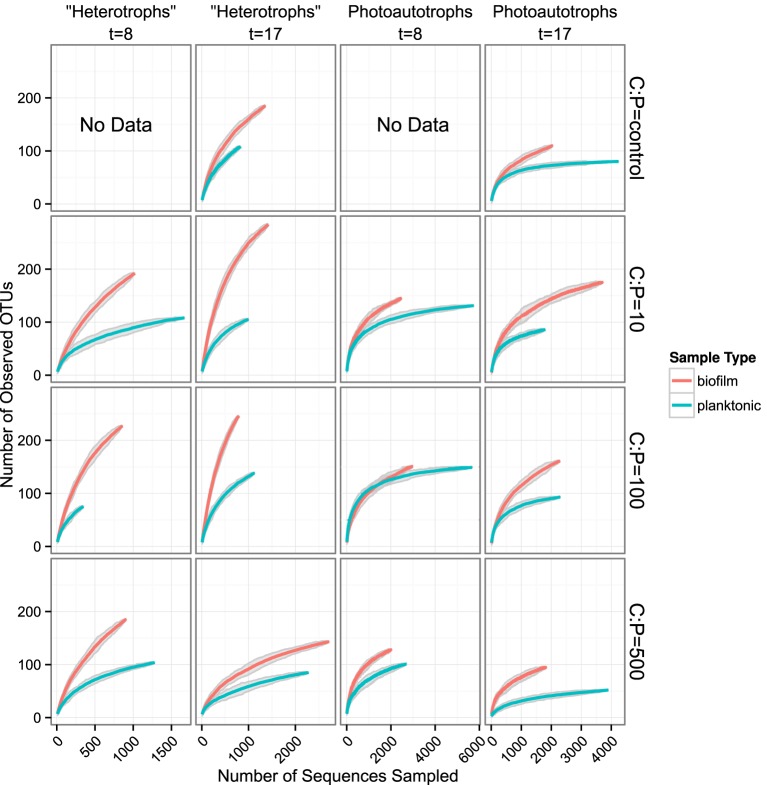
Figure 3.
Rarefaction curves for all biofilm vs. plankton libraries. Each panel represents a single C:P treatment and time point. Richness is greater for all biofilm communities when compared to corresponding planktonic communities. Gray ribbons are 99% confidence intervals around each rarefaction point based on variance from 25 re-samplings.

