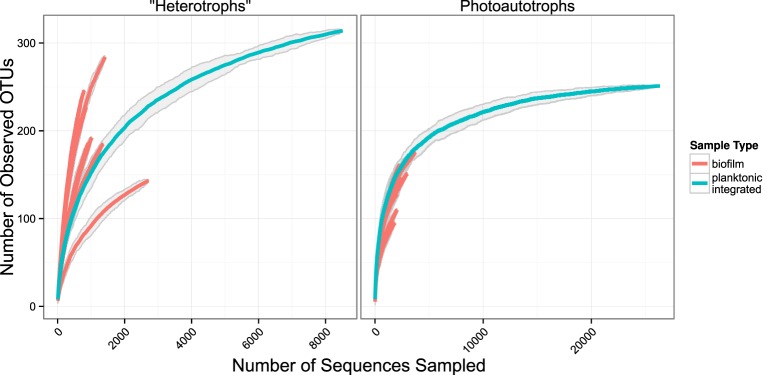
Figure 4.

Rarefaction plots for all samples. Planktonic libraries have been integrated such that the count for each OTU is the sum of counts across all samples. Gray ribbons are 99% confidence intervals around each rarefaction point based on variance from 25 re-samplings.
