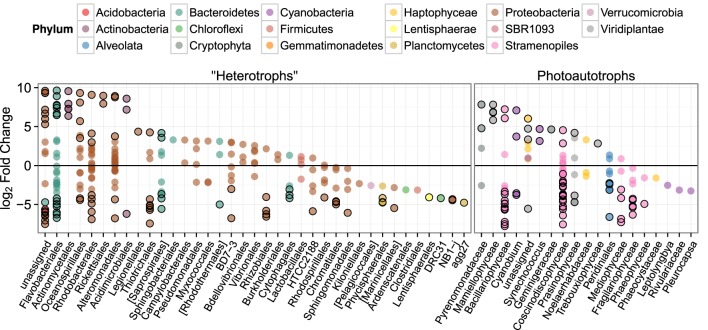
Figure 6.
log2 of lifestyle OTU abundance fold change between biofilm and plankton communities. Each point represents one OTU and points are grouped along the x-axis by Order. Outlined points have adjusted p-values below a false discovery rate of 0.10. Positive fold change values represent enrichment in planktonic samples.

