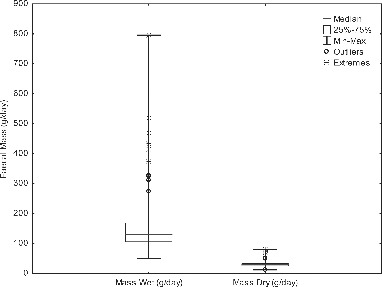
Figure 1 . Daily wet and dry mass of feces produced by human populations (g/cap/day). Outliers represent the upper value of the 75th percentile multiplied by the outlier coefficient (1.5), (extreme values = upper value of 75th percentile *2 outlier coefficient). Fecal wet mass generation (n = 112) has a large range and was an abnormal data set. Fecal dry mass (n = 61) showed a smaller range with fewer outliers and extreme values.

