
Figure 1. Time course of retinal degeneration in the rd10 mouse retina.
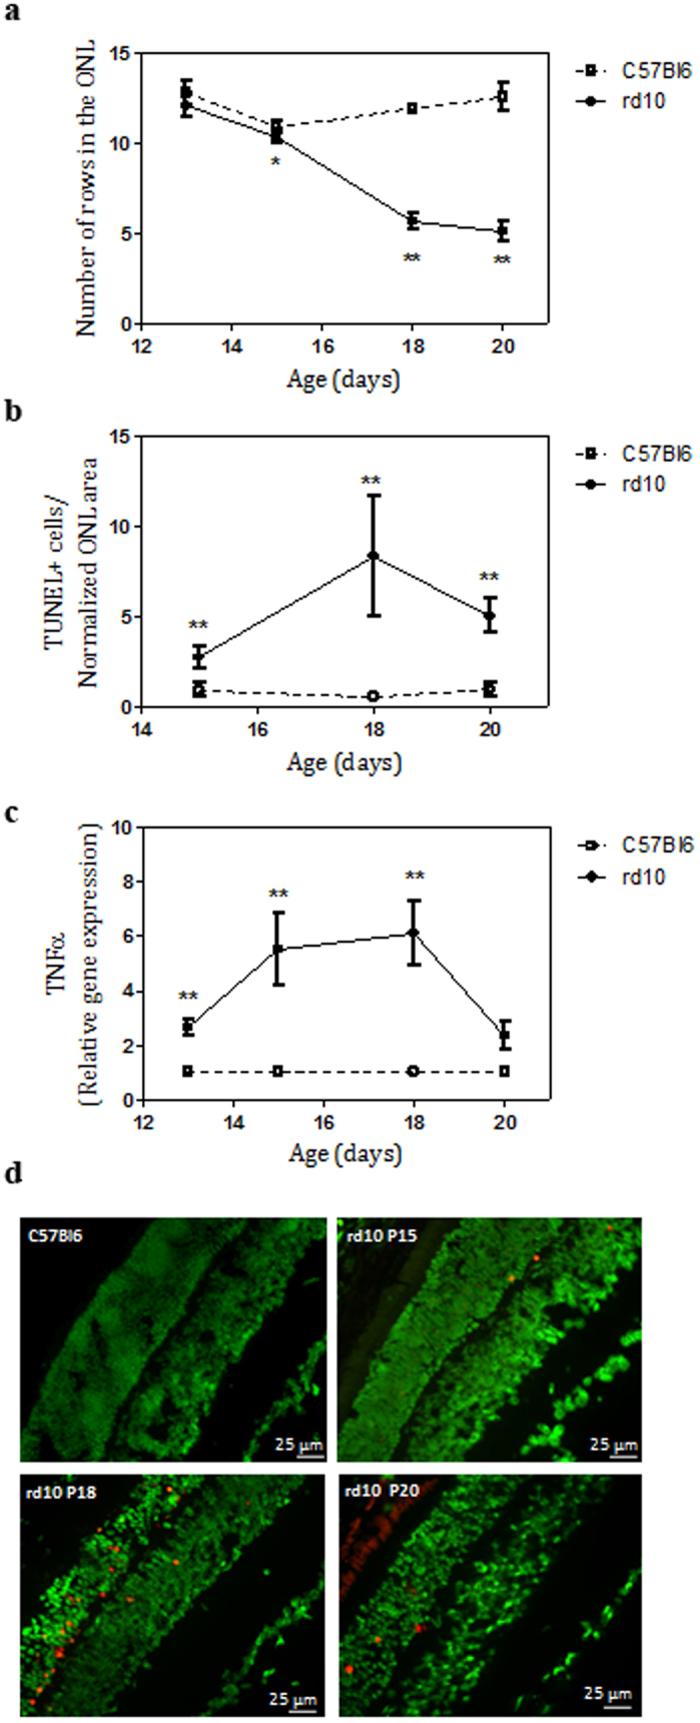
(a) Quantitation of the number of rows of photoreceptor nuclei from P13 to P20 in control (C57Bl6) and rd10 mice. (b) Number of TUNEL-positive cells by normalized ONL thickness in control and rd10 mice from P15 to P20. (c) Relative TNFα gene expression from P13 to P20 in rd10 mice. Values are the mean ± SEM of, at least, five retinas per group. Values that are significantly different are indicated by asterisks *p < 0.05, **p < 0.001, ***p < 0.0001 (Mann-Whitney U test). (d) Photoreceptor cell death was visualized by TUNEL (red) in Sytox Green-counterstained in retinal sections from control mice at P18 and from rd10 mice at P15, P18 and P20.