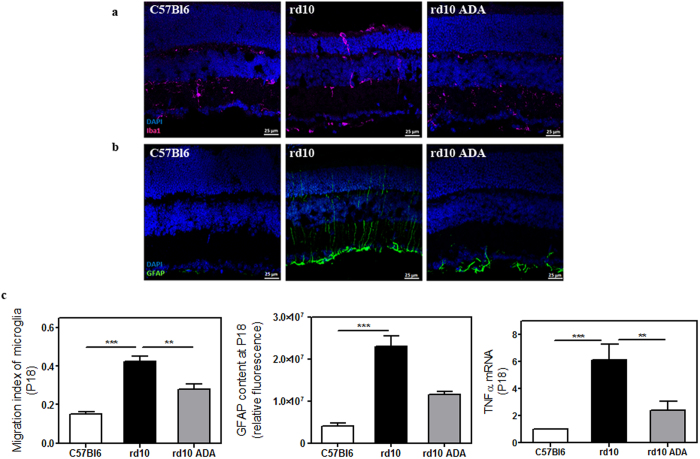
Figure 4. Adalimumab ameliorated reactive gliosis in the rd10 mouse retina at P18.
Representative photomicrographs of retinal sections showing (a) Iba1-labelling to visualize microglial cells and (b) GFAP content in DAPI-counterstained sections. (c) Bar graph illustrates the effect of Adalimumab (ADA) on migration index of microglia, the corrected fluorescence of GFAP content and TNFα gene expression. Values are the mean ± SEM of, at least, five retinas per group. Values that are significantly different are indicated by asterisks **p < 0.01, ***p < 0.001 (Mixed linear model analysis).

