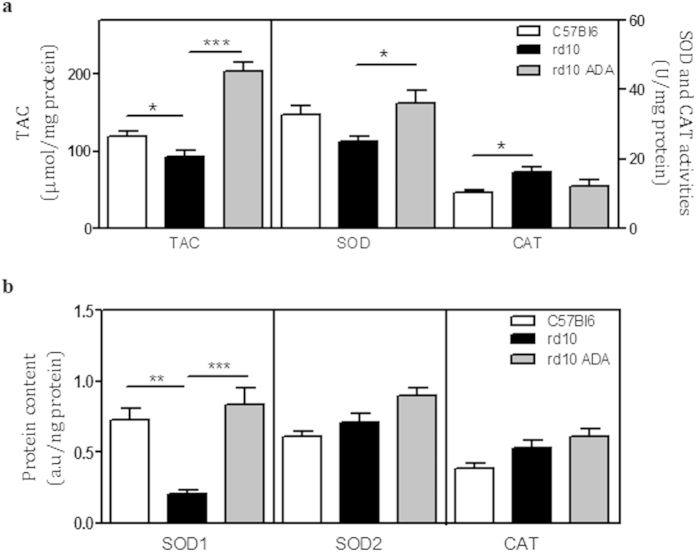
Figure 5. Adalimumab improved antioxidant response at P18.
Total antioxidant capacity (TAC), superoxide dismutase (SOD) and catalase (CAT) activities (a) and protein content of SOD1, SOD2 and CAT (b) were measured. Quantitation is shown in bar graphs. Values are the mean ± SEM of, at least, six retinas per group. Values that are significantly different are indicated by asterisks *p < 0.05, **p < 0.01, ***p < 0.001 (Mixed linear model analysis).

