
Figure 3. Increased intracellular oxidative stress and mitochondrial ROS levels in WT and RyR2-S2808D+/+ mice.
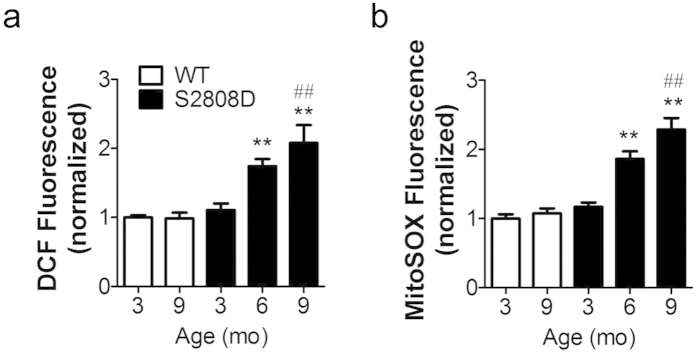
(a) atrial intracellular oxidative stress measured by CM-H2DCFDA, n > 100 cells from 3 ~ 4 mice in each group. (b) mitochondrial ROS levels in atrial myocytes, n > 140 cells from 3 ~ 4 mice in each group. The DCF and mitoSOX fluorescence are normalized to fold of 3-month-old WT group. All data are shown as mean ± s.e.m. * and **: p < 0.05 and 0.01 vs 3-month-old group; #, ##: p < 0.05 and 0.01 vs WT.