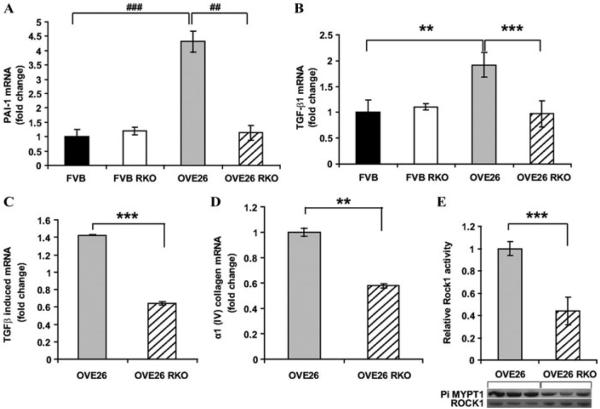
Figure 1.
PAI-1 (Serpine1), Tgf-β1, Tgf-β–induced, and α1-(IV) collagen mRNA transcripts and ROCK1 activity are lower in OVE26 RKO kidney cortex than in OVE26 kidney cortex at age seven months. Real-time PCR for PAI-1 (A), Tgf-β1 (B), Tgf-β1–induced (C), and α 1-(IV) collagen (D) gene products was performed, normalized to 18s transcript levels, and expressed as fold-change compared with the FVB or OVE26 group, as indicated in the figure (**P < 0.01, ***P < 0.005, ##P < 0.0005, ###P < 0.0001). n = at least 6 per group. (E) ROCK1 activity was measured as the amount of phosphorylated MYPT1 compared with total ROCK1 (*** P = 0.005). n = at least 3 per group. Reprinted with permission from Ref. 51.

