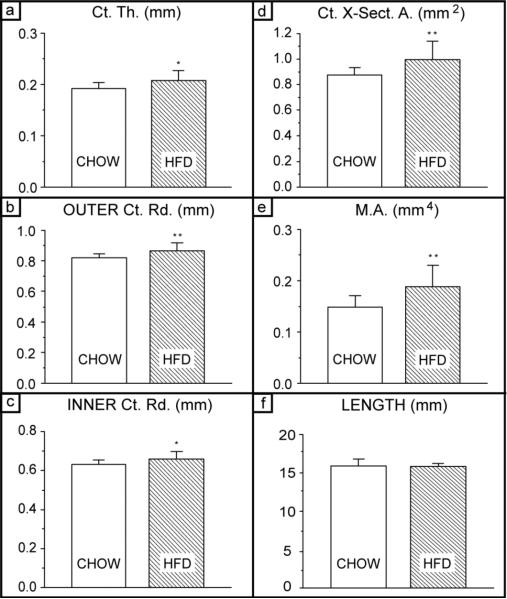
Fig. 3. Cortical bone quantity measures – Bone size.
(a) Average cortical thickness; (b) outer cortical thickness; (c) inner cortical radius; (d) cortical cross-sectional area; and (e) second moment of area. Significant increase (* P<0.05; ** P<0.01) for the HFD group is observed for all measures except (f) femoral length. (g) Whole-body bone mineral content (BMC); BMC is higher in the HFD group, which is expected because bones are larger (*** P<0.001). (f) Whole-body areal bone mineral denstiy (aBMD); and (i) volumetric bone mineral density (vBMD) of the femoral cortical bone are not significantly different between groups, which is not suprising as the lean body mass was unchanged (see Fig. 1). n=15 for the Chow group and n=14 for HFD group.

