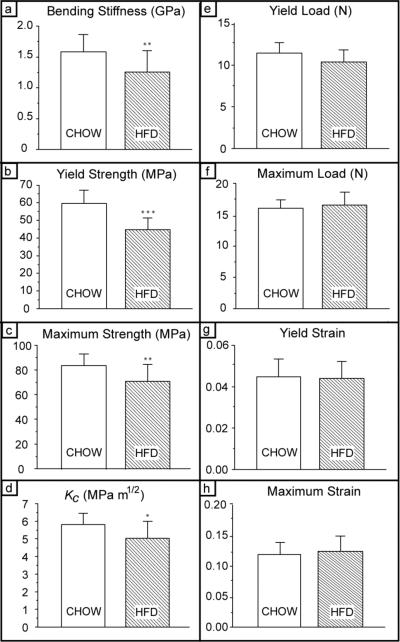
Fig. 4. Cortical bone quality: whole-bone and tissue-level mechanical property measurements.
(a) Yield strength; (b) maximum strength; (c) bending stiffness; (d) fracture toughness, Kc; (e) yield load; (f) maximum load; (g) yield strain; and (h) maximum strain. Measured size-independent mechanical properties (except strain) were significantly decreased for HFD group vs. Chow group despite increased bone size (a-f); these parameters are an indication of bone-tissue quality. Size-dependent measures which address whole-bone behavior (specifically, load) did not differ between groups indicating a compensatory mechanism between bone size and tissue quality. n=15 for the Chow group and n=14 for HFD group (* P<0.05; ** P<0.01; *** P<0.001).

