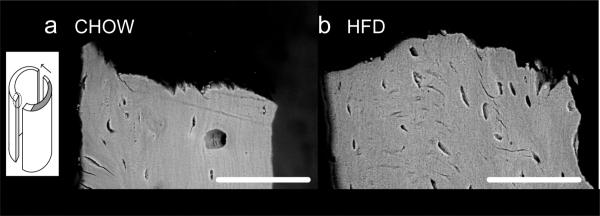
Fig. 5. Through-wall SEM images of fracture region showing tissue structure at the whole-bone scale.

a) Cortical wall in bone from Chow group; (b) Cortical wall in HFD group. The scale bar indicates 100 μm. The medial cortex in HFD bone (b) shows reduced alignment of osteocyte lacunae and reduction in lamellar alignment at the tissue level. These images are representative of five samples each of HFD and Chow. The inset indicates that images were taken from vertical sections through a region beyond the notch at the crack surface. The dark grey region indicates the notch, and the arrow indicates direction of crack growth, with crack propagation happening evenly from both sides of the notch.
