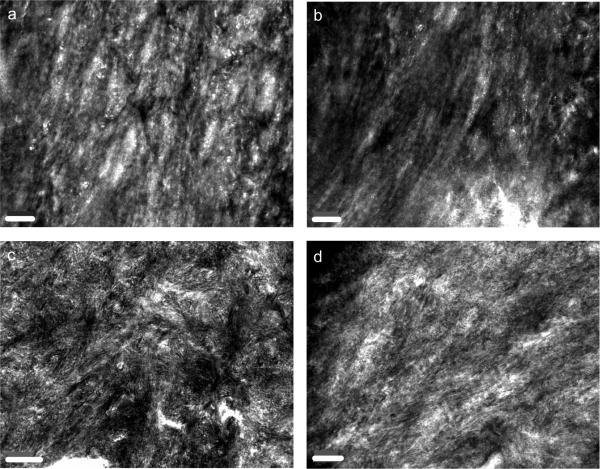
Fig. 6. High-magnification TEM images of structure and mineral organization.
(a) and (b) Mineral organization of bone from Chow group; as well as (c) and (d) mineral organization of bone from HFD group. The scale bar indicates 200 nm. Mineral appears more poorly aligned and organized in HFD bone than in Chow bone, suggesting a reduction in microstructural tissue quality.

