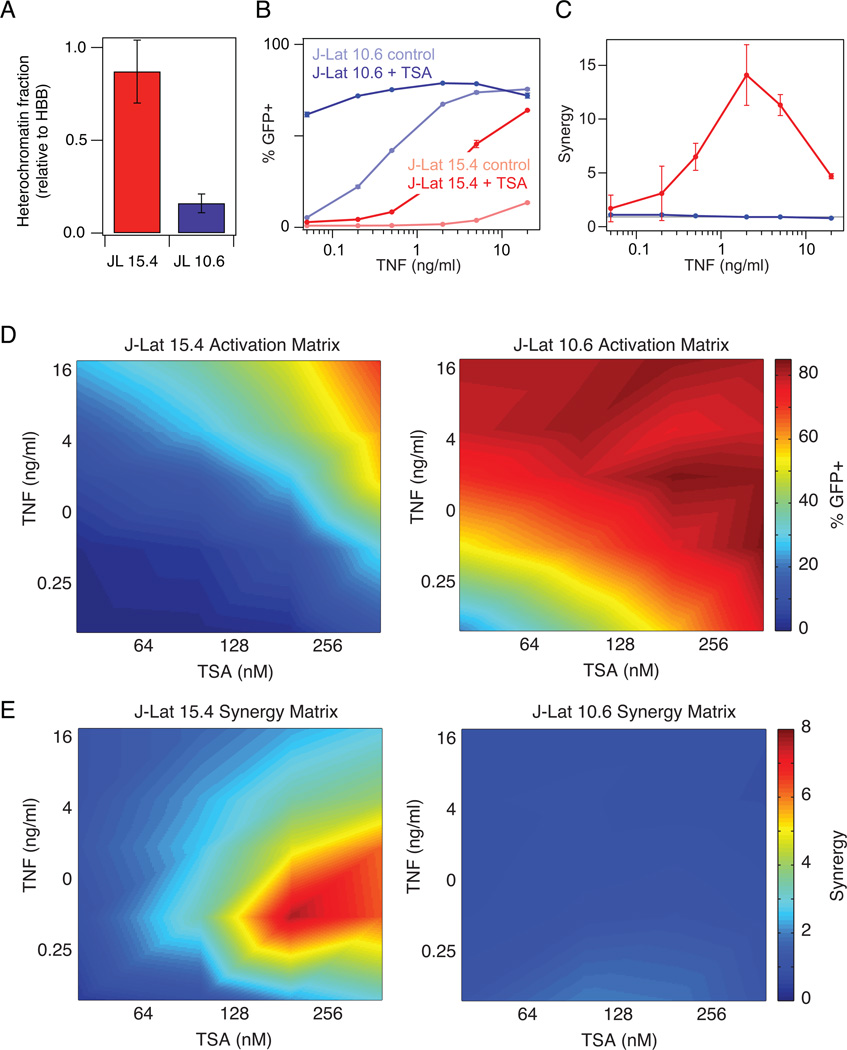
Figure 1. Comparison of TNF-TSA synergy in activating latent HIV proviruses subject to different levels of chromatin repression.
(A) Nuclease sensitivity at the HIV LTR was measured relative to the hemoglobin B (HBB) reference gene. Data are reported as the mean ± standard deviation of two measurements. (B) Dose response of activation by TNF of J-Lat 15.4 (red) and J-Lat 10.6 (blue) in the presence and absence of 400 nM TSA. GFP expression was measured by flow cytometry. Data are reported as the mean ± standard deviation of 3 biological replicates (note that some error bars are not visible). (C) Quantification of drug synergy between TNF and TSA using the Bliss independence model of drug interactions. Gray line at Synergy = 1 indicates no detectable drug interaction. (D-E) Heat map of activation (D) and drug synergy (E) of J-Lat 15.4 (left) and J-Lat 10.6 (right) for a matrix of TNF and TSA doses. Activation and synergy values were linearly interpolated to produce a continuous plot.

