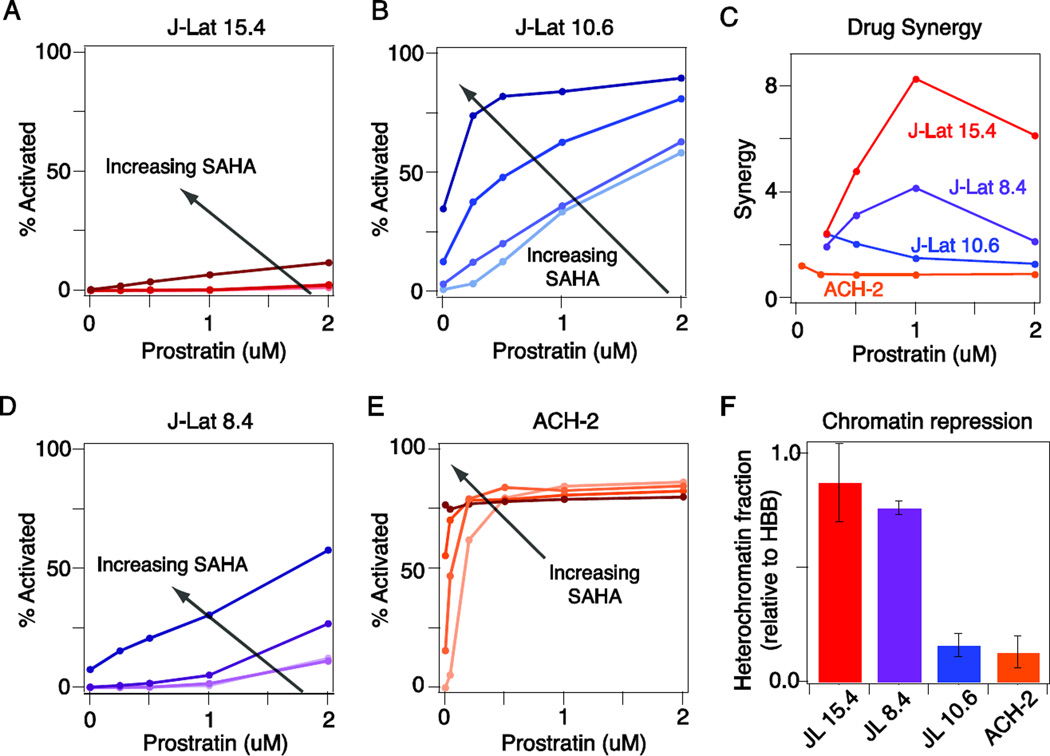
Figure 2. Comparison of prostratin-SAHA synergy in activating latent HIV proviruses subject to different levels of chromatin repression.
A-B) Dose response of activation by prostratin of J-Lat 15.4 (A) and J-Lat 10.6 (B) in the presence of increasing doses of SAHA (0, 1, 2, and 4 uM with darker shade indicating higher dose). Viral activation was assessed by GFP expression, which was measured by flow cytometry. C) Calculation of drug synergy in the presence of 2 uM SAHA. D-E) Dose response of activation by prostratin of J-Lat 8.4 (D) and ACH-2 (E) in the presence of increasing doses of SAHA (same as in A-B). Viral activation was assessed by GFP expression (J-Lat 8.4) or anti-HIV-1 core antigen staining (ACH-2) and measured by flow cytometry. F) Nuclease sensitivity at the HIV LTR relative to the HBB reference gene. Data are reported as the mean ± standard deviation of two measurements.

