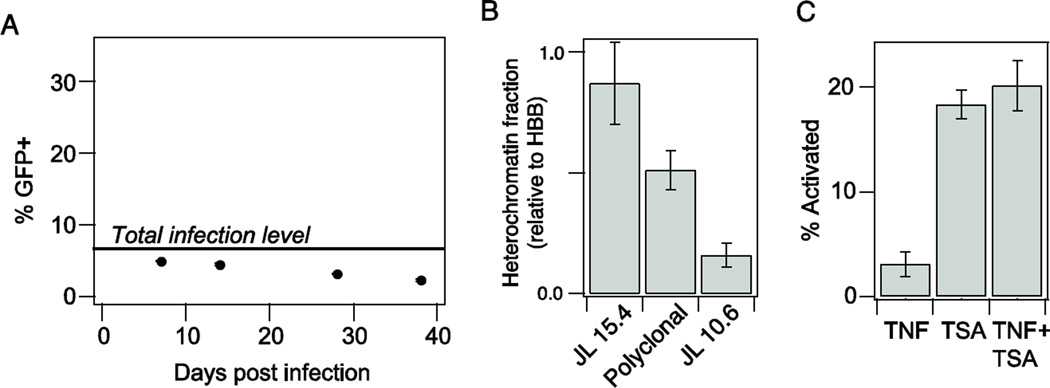
Figure 4. TNF-TSA drug synergy was not observed for a polyclonal latently infected population.
A) Quantification of latent population over time. Gray line indicates the total level of infection as measured by activation with 10 mM PMA and 400 nM TSA. B) Nuclease sensitivity at the HIV LTR relative to the hemoglobin B (HBB) reference gene. Data are reported as the mean ± standard deviation of two measurements. C) Activation of the polyclonal latent population with 10 ng/ml TNF and/or 400 nM TSA. GFP expression was measured by flow cytometry. % activation was normalized to the total observed infection level (indicated in A). Data are reported as the mean ± standard deviation of three biological replicates.

