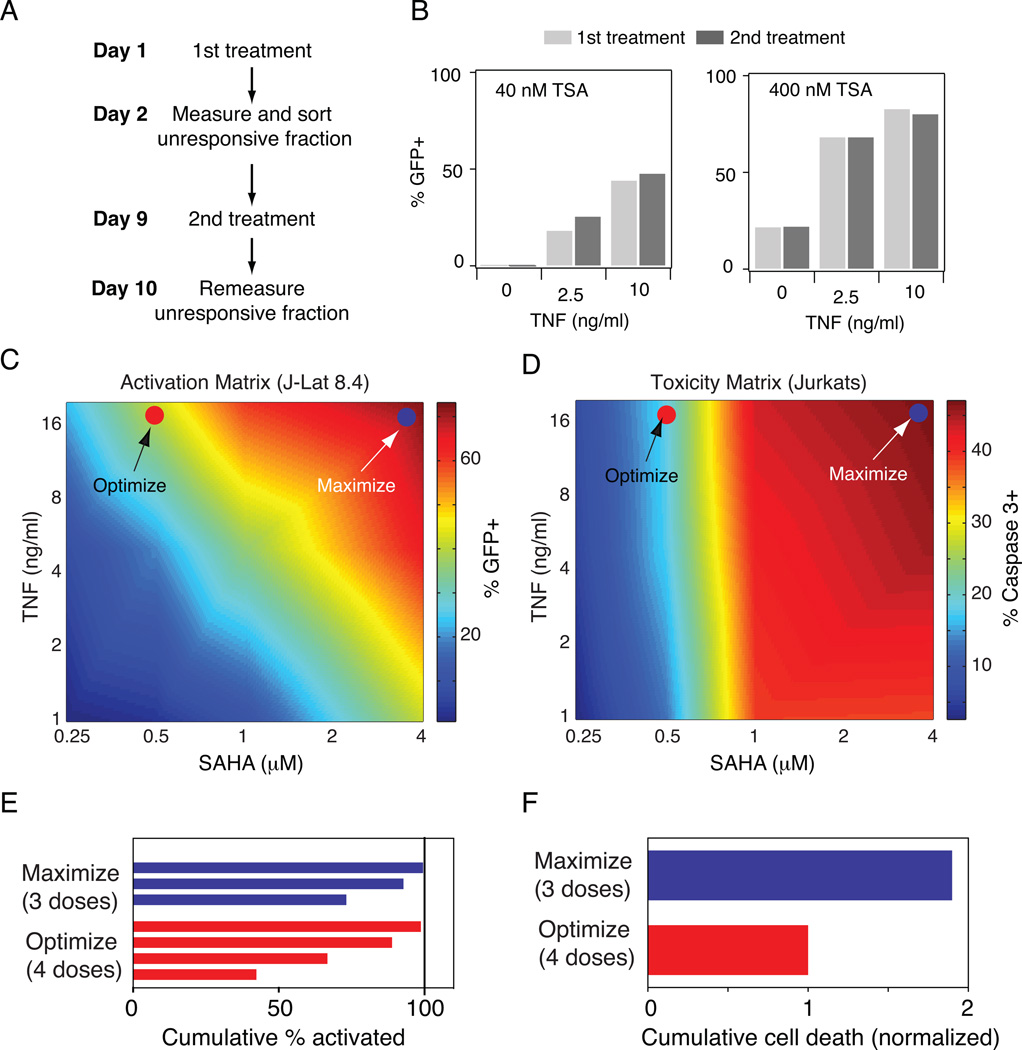
Figure 6. Optimization of drug synergy to reduce off-target toxicity during latency activation.
A) Schematic of experimental protocol to mimic multiple stimulations of latent infections. B) Activation of J-Lat 8.4 by TNF and TSA before sorting the unresponsive fraction (1st treatment; light gray bars) and after sorting the unresponsive fraction (2nd treatment; dark gray bars). C-D) Heat maps of (C) activation of J-Lat 8.4 and (D) toxicity in uninfected Jurkat cells for a matrix of TNF and SAHA doses. GFP expression was measured by flow cytometry and toxicity was measured by staining for anti-active caspase 3. Activation and toxicity values were measured for a range of doses and were linearly interpolated to produce a continuous plot (see Supp. Tables S1-2 for data matrix values). E-F) Cumulative activation and F) cumulative toxicity for repeated dosing of a combination TNF+SAHA that maximizes total activation (blue) or optimizes between activation and toxicity (red).

