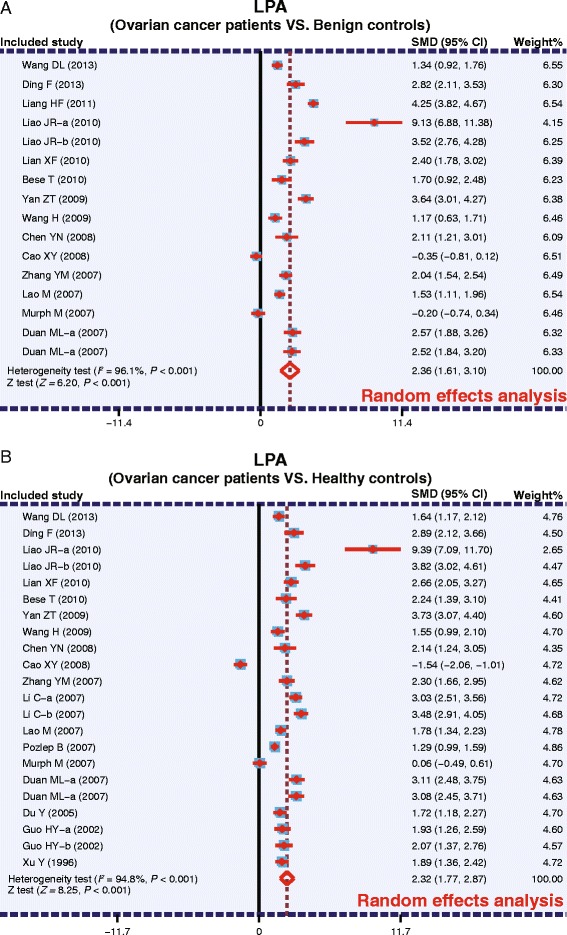
Fig. 3.

Forest plots for the relationship between plasma lysophosphatidic acid levels and ovarian cancer (a: Ovarian cancer patients VS. Benign controls; b: Ovarian cancer patients VS. Healthy controls)

Forest plots for the relationship between plasma lysophosphatidic acid levels and ovarian cancer (a: Ovarian cancer patients VS. Benign controls; b: Ovarian cancer patients VS. Healthy controls)