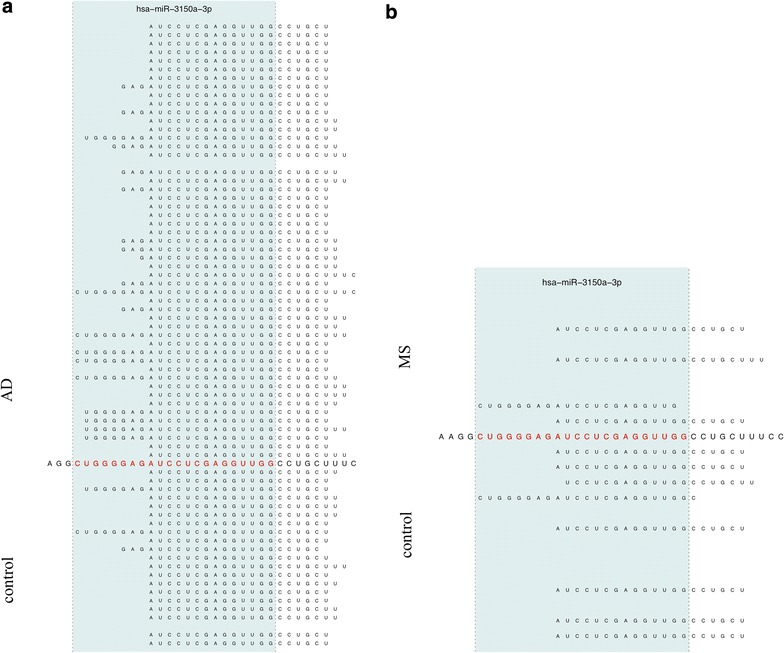
Figure 3.

Pileup plot for miR-3150a-3p. The figure presents an extract of pileup plots for hsa-miR-3150a-3p in the two studies (a AD; b MS). Samples on top represent cases and on bottom controls. Each sample where at least a single read mapped to the precursor get an own line. The sequence in the middle corresponds to the precursor sequence, the mature miRNA (in this case the 3p mature form) is colored in red. The blue shaded area marks the mature part of this miRNA. In both cases, AD and MS, reads are partially mapping outside the mature form of this miRNA.
