
Fig. 5.
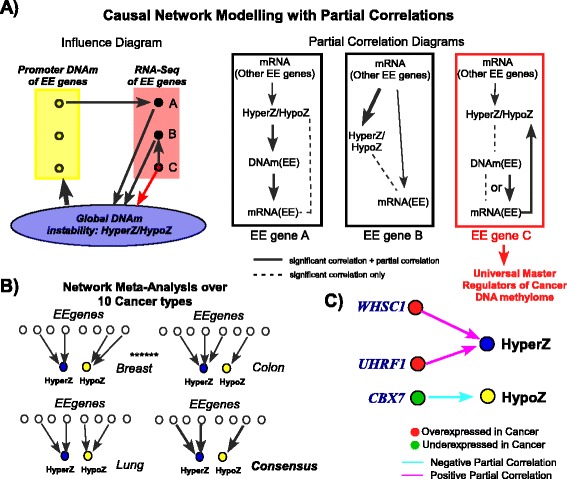
Causal network modeling meta-analysis. a Influence diagram depicts how correlations between expression of EE genes and HyperZ/HypoZ could arise. For gene A, global changes in DNAm affect the DNAm level in its promoter, thereby affecting its expression, resulting in a spurious correlation between mRNA of gene A and HyperZ/HypoZ. For gene B, the correlation of its expression with HyperZ/HypoZ is driven by the expression of another EE gene. For gene C, there is a direct influence between its expression and HyperZ/HypoZ. The partial correlation diagram depicts how these different models can be discriminated. Only for EE genes following model C would we see a significant partial correlation between their expression and HyperZ/HypoZ, whereas for genes of type A and B we would not. b A partial correlation network is derived for each tissue type and results summarized in a meta-analysis over the resulting networks. c Result of the causal network modeling meta-analysis (across all ten cancers) using partial correlation coefficients, identifying three EE genes whose expression patterns associate with HyperZ or HypoZ independently of other EE gene expression and their promoter DNAm levels