
Figure 5.
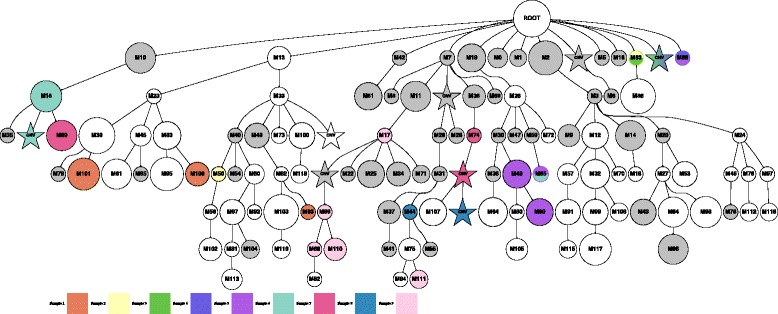
Example of a small simulated lineage tree (with SSNV and CNV events) with localized sampling (nine tumor samples in total indicated by different colors). Each node represents a cell population that contains every mutation in its lineage. Gray indicates dead cell populations. CNV, copy number variant; SSNV, somatic single nucleotide variant.