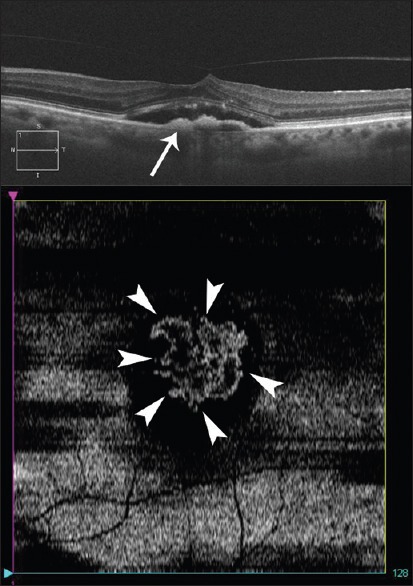
Figure 2.

Spectral domain optical coherence tomography B-scan showing a type 1 membrane in an eye with occult choroidal neovascularization (top image-arrow). En-face image (bottom image) at the level of retinal pigment epithelium showing the total extent of the occult membrane (arrowheads)
