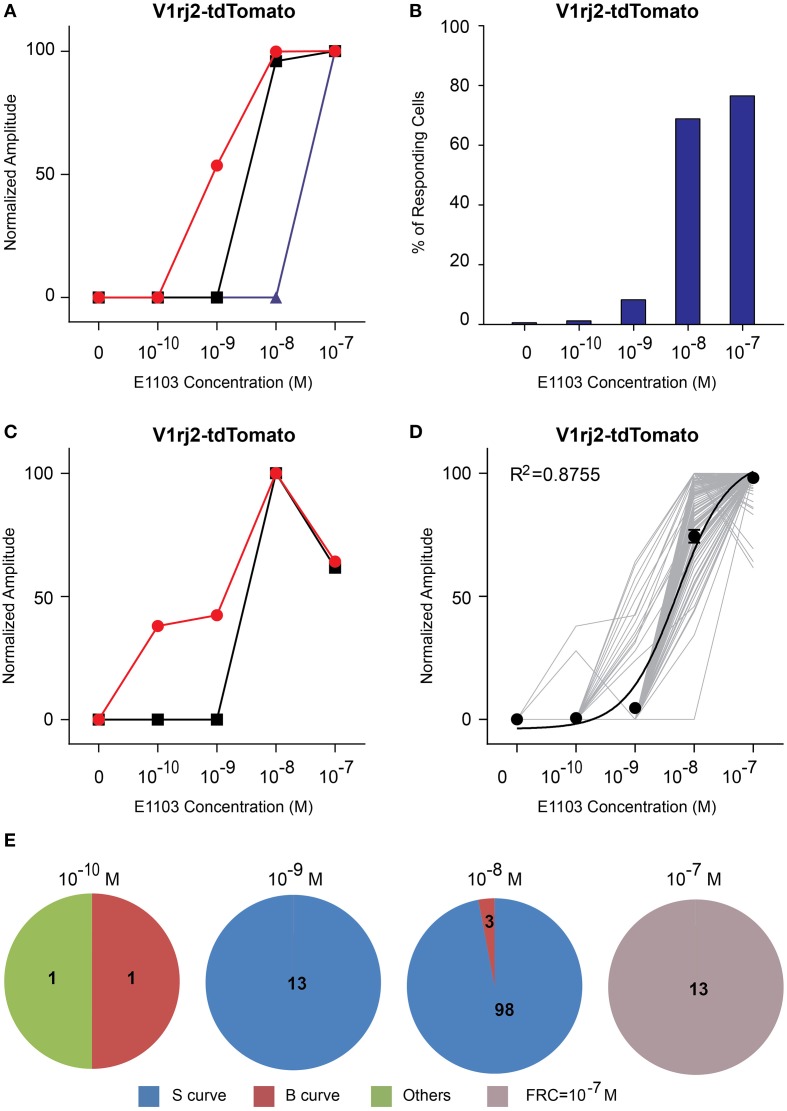
Figure 5.
Activation of V1rj2 by E1103. (A) Examples of sigmoidal dose-response curves to E1103 in V1rj2 cells. (B) Bar graph showing the percentage of E1103 activated V1rj2 cells (n = 129). (C) Examples of bell-shaped dose-dependent responses of V1rj2 cells to E1103. (D) Dose-response curves of individual cells (gray) and a sigmoidal curve (black) fitted to the average amplitude from all cells. Error bar, S.E.M. (E) Pie charts showing the number of cells exhibiting sigmoidal (S, blue), bell-shaped (B, red), and other (O, green) types of dose responses. Cells with FRC of 10−7 M are shown in gray.

