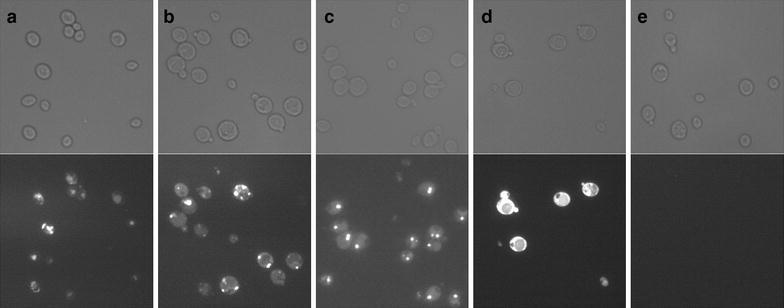
Figure 4.

Fluorescence microscopy of fusions of HRP to GFP. Bright field images are shown on top, fluorescence images below. a HRP N-terminally tagged with eGFP (#9-MFalpha-N-eGFP-HRP), b HRP C-terminally tagged with eGFP (#10-MFalpha-C-eGFP-HRP), c control of eGFP with MFalpha (self-ligated #9), d control of cytoplasmic eGFP expression (#1-eGFP), e negative control of empty MutS strain. For the bright field image of panel (c) brightness was decreased −11%, contrast was increased +44% for better comparability with the other panels.
