
Figure 4.
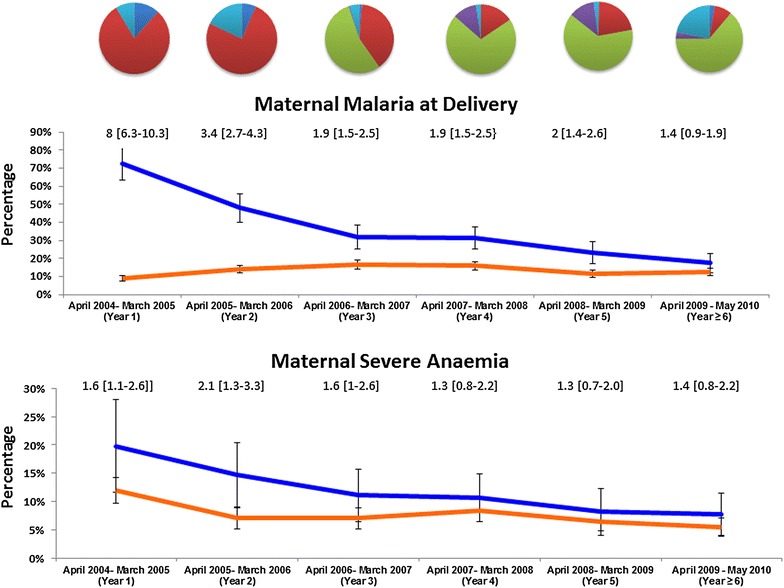
Maternal adverse outcomes in women with history of malaria treatment during pregnancy (blue line) and in those without history of malaria treatment (orange line). The pie chart above the figures denote the proportions of women with prior anti-malarial exposure: Quinine: red, DHP: light green, CQ ± SP: light blue, AAQ: purple, Others: dark blue. Numbers above the lines are RR (95% CI). Black arrow marks the start of policy change.