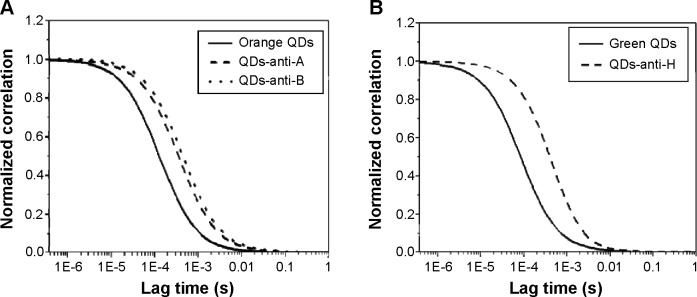
Figure 3.

Normalized FCS correlation curves of bare and conjugated QDs.
Notes: (A) FCS curves of bare orange QDs (solid line), QDs-anti-A (dashed line), and QDs-anti-B (dotted line). (B) FCS curves of bare green QDs (solid line) and QDs-anti-H (dashed line).
Abbreviations: FCS, fluorescence correlation spectroscopy; QDs, quantum dots.
